29
/
en
AIzaSyAYiBZKx7MnpbEhh9jyipgxe19OcubqV5w
April 1, 2024
47356
Lower middle income
LMC
false
2
1
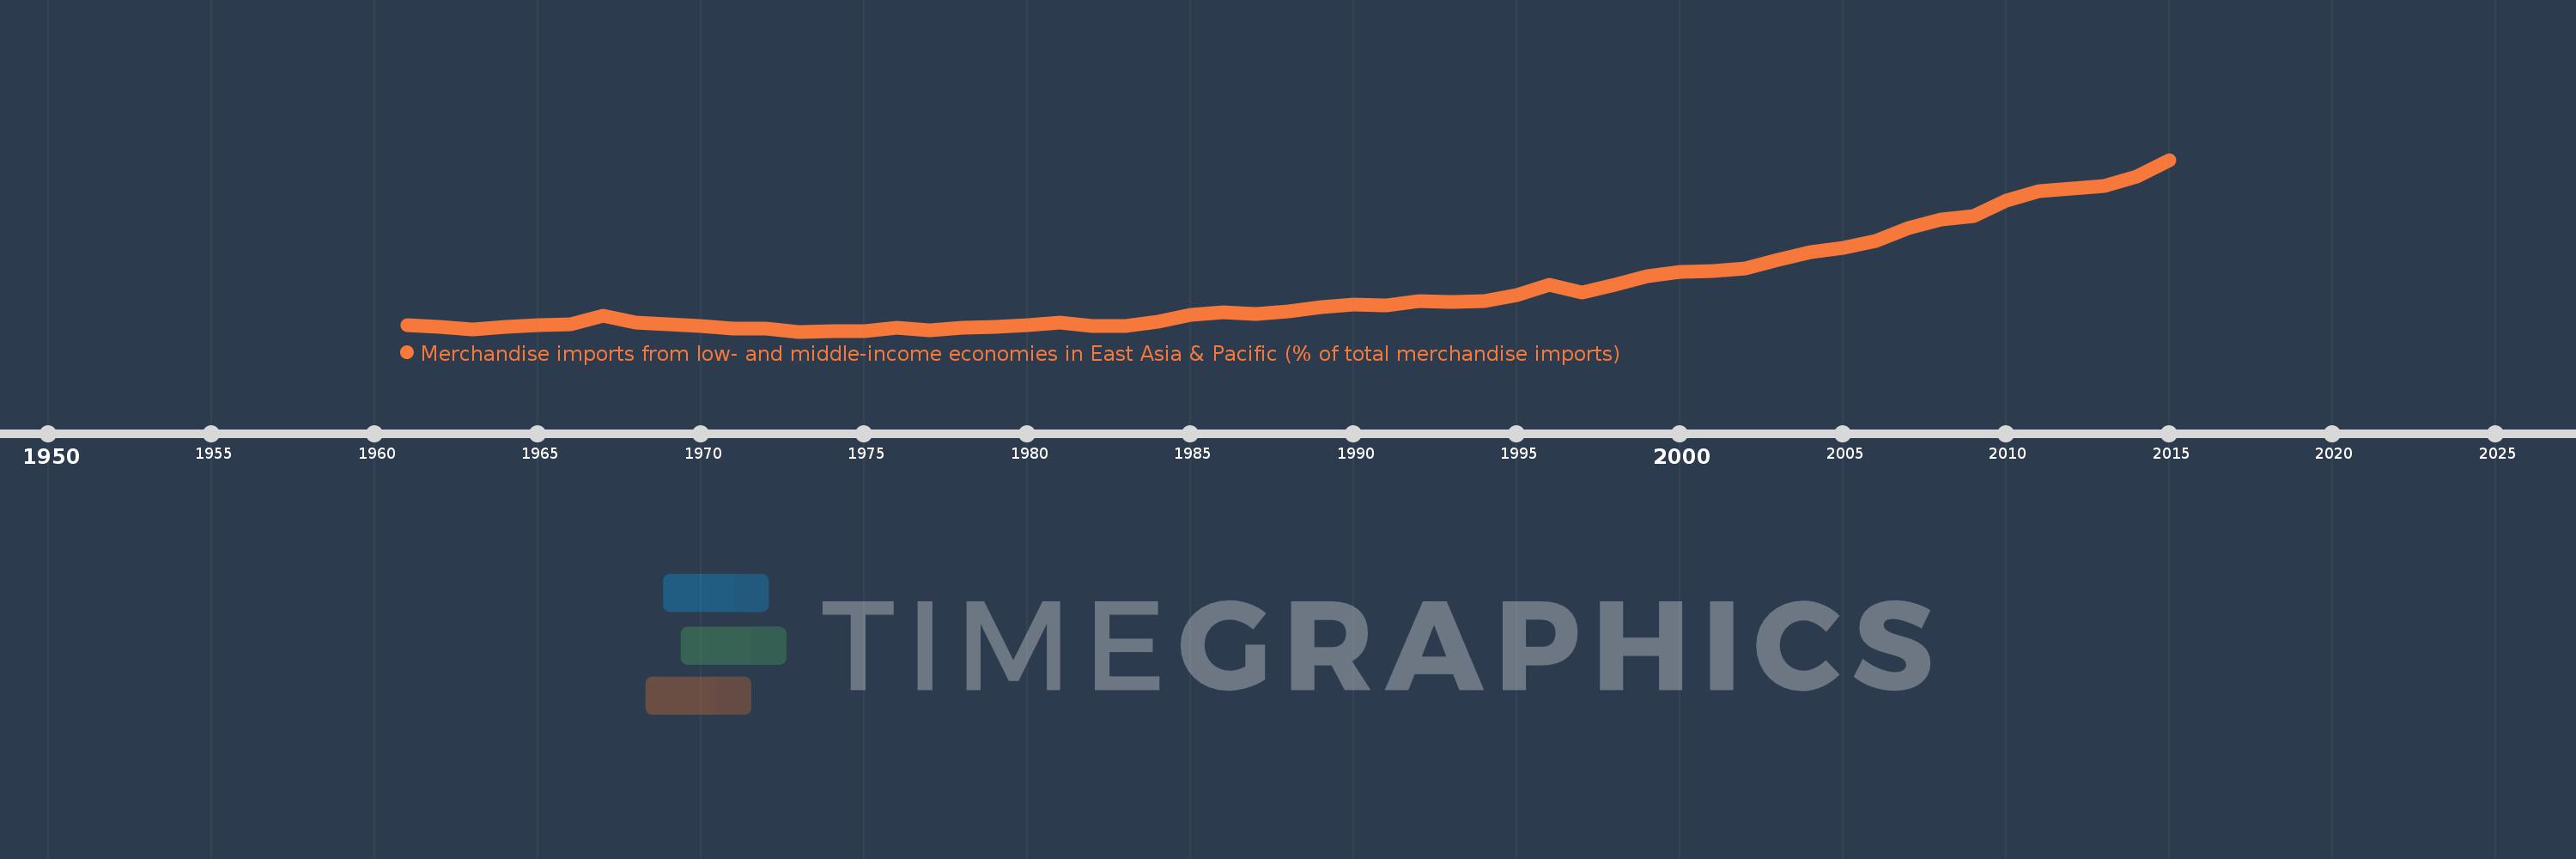
Merchandise imports from low- and middle-income economies in East Asia & Pacific (% of total merchandise imports)
2015,2014,2013,2012,2011,2010,2009,2008,2007,2006,2005,2004,2003,2002,2001,2000,1999,1998,1997,1996,1995,1994,1993,1992,1991,1990,1989,1988,1987,1986,1985,1984,1983,1982,1981,1980,1979,1978,1977,1976,1975,1974,1973,1972,1971,1970,1969,1968,1967,1966,1965,1964,1963,1962,1961
This statistics in other country:
AfghanistanAlbaniaAlgeriaArab WorldArgentinaArmeniaArubaAustraliaAustriaAzerbaijanBahamas, TheBahrainBangladeshBarbadosBelarusBelgiumBelizeBeninBermudaBoliviaBrazilBrunei DarussalamBulgariaBurkina FasoBurundiCabo VerdeCambodiaCameroonCanadaCaribbean small statesCentral African RepublicCentral Europe and the BalticsChileChinaColombiaCongo, Rep.Costa RicaCote d'IvoireCroatiaCyprusCzech RepublicDenmarkDominicaDominican RepublicEarly-demographic dividendEast Asia & PacificEast Asia & Pacific (excluding high income)East Asia & Pacific (IDA & IBRD countries)EcuadorEgypt, Arab Rep.El SalvadorEstoniaEthiopiaEuro areaEurope & Central AsiaEurope & Central Asia (excluding high income)Europe & Central Asia (IDA & IBRD countries)European UnionFijiFinlandFragile and conflict affected situationsFranceFrench PolynesiaGabonGambia, TheGeorgiaGermanyGhanaGreeceGreenlandGrenadaGuatemalaHaitiHeavily indebted poor countries (HIPC)High incomeHondurasHong Kong SAR, ChinaHungaryIBRD onlyIcelandIDA & IBRD totalIDA blendIDA onlyIDA totalIndiaIndonesiaIran, Islamic Rep.IraqIrelandIsraelItalyJamaicaJapanJordanKazakhstanKenyaKorea, Dem. People’s Rep.Korea, Rep.KuwaitKyrgyz RepublicLao PDRLate-demographic dividendLatin America & Caribbean Latin America & Caribbean (excluding high income)Latin America & the Caribbean (IDA & IBRD countries)LatviaLeast developed countries: UN classificationLebanonLithuaniaLow & middle incomeLow incomeLower middle incomeLuxembourgMacao SAR, ChinaMacedonia, FYRMadagascarMalaysiaMaliMaltaMauritiusMexicoMiddle East & North AfricaMiddle East & North Africa (excluding high income)Middle East & North Africa (IDA & IBRD countries)Middle incomeMoldovaMongoliaMontenegroMoroccoMyanmarNetherlandsNew CaledoniaNew ZealandNicaraguaNigerNigeriaNorth AmericaNorwayOECD membersOmanOther small statesPacific island small statesPakistanPanamaPapua New GuineaParaguayPeruPhilippinesPolandPortugalPost-demographic dividendPre-demographic dividendQatarRomaniaRussian FederationSamoaSaudi ArabiaSenegalSerbiaSingaporeSlovak RepublicSloveniaSmall statesSolomon IslandsSomaliaSouth AfricaSouth AsiaSouth Asia (IDA & IBRD)SpainSri LankaSt. Kitts and NevisSt. LuciaSt. Vincent and the GrenadinesSub-Saharan Africa Sub-Saharan Africa (excluding high income)Sub-Saharan Africa (IDA & IBRD countries)SurinameSwedenSwitzerlandTanzaniaThailandTogoTongaTrinidad and TobagoTunisiaTurkeyUgandaUkraineUnited Arab EmiratesUnited KingdomUnited StatesUpper middle incomeUruguayVanuatuVenezuela, RBVietnamWorldYemen, Rep.ZambiaZimbabwe Timeline:
This timeline shows a graph from 1961 to 2015 of Lower middle income. No data until 1960. Number of actual observations by date: 55.
Source name:
World Development Indicators
Source organization:
World Bank staff estimates based data from International Monetary Fund's Direction of Trade database.
Categories, topics:
Private Sector, Trade
Last updated:
apr 23, 2017
Indicators value changes by year
Maximum:
25.207
jan 1, 2015
At the date of observation
Value
Absolute change
Change from previous value
jan 1, 1961
2.104
+2.104
0.0%
jan 1, 1962
1.912
-0.192
-9.13%
jan 1, 1963
1.554
-0.359
-18.76%
jan 1, 1964
1.837
+0.284
18.25%
jan 1, 1965
2.095
+0.258
14.05%
jan 1, 1966
2.175
+0.08
3.82%
jan 1, 1967
3.447
+1.272
58.46%
jan 1, 1968
2.413
-1.034
-29.99%
jan 1, 1969
2.247
-0.166
-6.87%
jan 1, 1970
2.025
-0.222
-9.9%
jan 1, 1971
1.653
-0.372
-18.35%
jan 1, 1972
1.653
0.0
0.0%
jan 1, 1973
1.2
-0.453
-27.43%
jan 1, 1974
1.314
+0.114
9.48%
jan 1, 1975
1.309
-0.005
-0.39%
jan 1, 1976
1.692
+0.383
29.28%
jan 1, 1977
1.424
-0.268
-15.84%
jan 1, 1978
1.785
+0.361
25.35%
jan 1, 1979
1.867
+0.082
4.61%
jan 1, 1980
2.083
+0.216
11.54%
jan 1, 1981
2.496
+0.413
19.85%
jan 1, 1982
1.973
-0.523
-20.96%
jan 1, 1983
1.93
-0.042
-2.15%
jan 1, 1984
2.626
+0.696
36.04%
jan 1, 1985
3.559
+0.933
35.54%
jan 1, 1986
3.932
+0.373
10.48%
jan 1, 1987
3.641
-0.291
-7.4%
jan 1, 1988
4.057
+0.416
11.43%
jan 1, 1989
4.586
+0.528
13.02%
jan 1, 1990
4.97
+0.384
8.38%
jan 1, 1991
4.843
-0.126
-2.54%
jan 1, 1992
5.435
+0.592
12.22%
jan 1, 1993
5.381
-0.054
-0.99%
jan 1, 1994
5.512
+0.131
2.43%
jan 1, 1995
6.285
+0.772
14.01%
jan 1, 1996
7.779
+1.494
23.78%
jan 1, 1997
6.687
-1.091
-14.03%
jan 1, 1998
7.741
+1.053
15.75%
jan 1, 1999
8.988
+1.247
16.11%
jan 1, 2000
9.564
+0.577
6.42%
jan 1, 2001
9.692
+0.128
1.34%
jan 1, 2002
10.024
+0.332
3.42%
jan 1, 2003
11.195
+1.171
11.68%
jan 1, 2004
12.289
+1.094
9.77%
jan 1, 2005
12.848
+0.559
4.55%
jan 1, 2006
13.861
+1.013
7.88%
jan 1, 2007
15.62
+1.759
12.69%
jan 1, 2008
16.856
+1.236
7.91%
jan 1, 2009
17.369
+0.514
3.05%
jan 1, 2010
19.527
+2.158
12.42%
jan 1, 2011
20.77
+1.243
6.37%
jan 1, 2012
21.182
+0.412
1.98%
jan 1, 2013
21.513
+0.33
1.56%
jan 1, 2014
22.875
+1.363
6.33%
jan 1, 2015
25.207
+2.332
10.19%
Ranking of countries by current statistics by years


Comments: