29
/
en
AIzaSyAYiBZKx7MnpbEhh9jyipgxe19OcubqV5w
April 1, 2024
73230
Australia
AUS
true
2
1
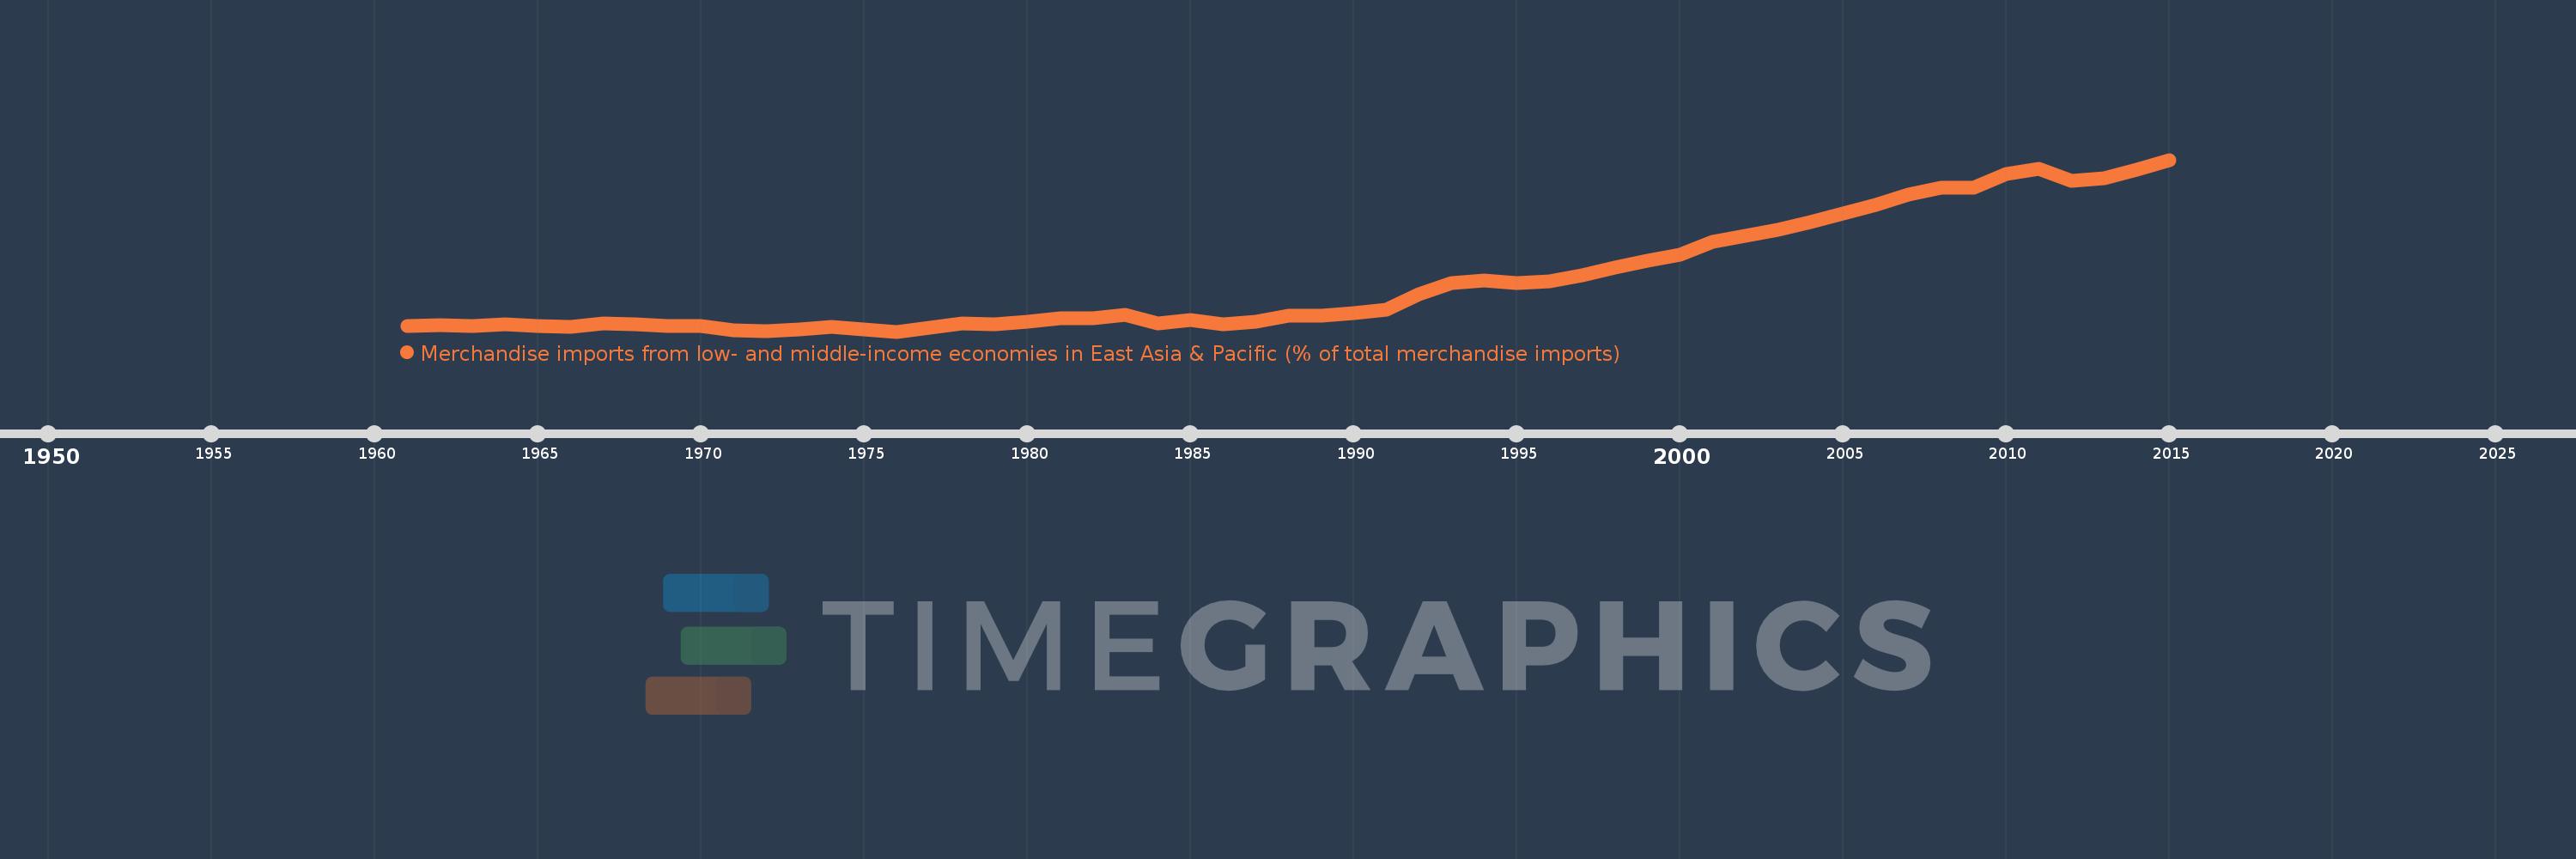
Merchandise imports from low- and middle-income economies in East Asia & Pacific (% of total merchandise imports)
2015,2014,2013,2012,2011,2010,2009,2008,2007,2006,2005,2004,2003,2002,2001,2000,1999,1998,1997,1996,1995,1994,1993,1992,1991,1990,1989,1988,1987,1986,1985,1984,1983,1982,1981,1980,1979,1978,1977,1976,1975,1974,1973,1972,1971,1970,1969,1968,1967,1966,1965,1964,1963,1962,1961
This statistics in other country:
AfghanistanAlbaniaAlgeriaArab WorldArgentinaArmeniaArubaAustraliaAustriaAzerbaijanBahamas, TheBahrainBangladeshBarbadosBelarusBelgiumBelizeBeninBermudaBoliviaBrazilBrunei DarussalamBulgariaBurkina FasoBurundiCabo VerdeCambodiaCameroonCanadaCaribbean small statesCentral African RepublicCentral Europe and the BalticsChileChinaColombiaCongo, Rep.Costa RicaCote d'IvoireCroatiaCyprusCzech RepublicDenmarkDominicaDominican RepublicEarly-demographic dividendEast Asia & PacificEast Asia & Pacific (excluding high income)East Asia & Pacific (IDA & IBRD countries)EcuadorEgypt, Arab Rep.El SalvadorEstoniaEthiopiaEuro areaEurope & Central AsiaEurope & Central Asia (excluding high income)Europe & Central Asia (IDA & IBRD countries)European UnionFijiFinlandFragile and conflict affected situationsFranceFrench PolynesiaGabonGambia, TheGeorgiaGermanyGhanaGreeceGreenlandGrenadaGuatemalaHaitiHeavily indebted poor countries (HIPC)High incomeHondurasHong Kong SAR, ChinaHungaryIBRD onlyIcelandIDA & IBRD totalIDA blendIDA onlyIDA totalIndiaIndonesiaIran, Islamic Rep.IraqIrelandIsraelItalyJamaicaJapanJordanKazakhstanKenyaKorea, Dem. People’s Rep.Korea, Rep.KuwaitKyrgyz RepublicLao PDRLate-demographic dividendLatin America & Caribbean Latin America & Caribbean (excluding high income)Latin America & the Caribbean (IDA & IBRD countries)LatviaLeast developed countries: UN classificationLebanonLithuaniaLow & middle incomeLow incomeLower middle incomeLuxembourgMacao SAR, ChinaMacedonia, FYRMadagascarMalaysiaMaliMaltaMauritiusMexicoMiddle East & North AfricaMiddle East & North Africa (excluding high income)Middle East & North Africa (IDA & IBRD countries)Middle incomeMoldovaMongoliaMontenegroMoroccoMyanmarNetherlandsNew CaledoniaNew ZealandNicaraguaNigerNigeriaNorth AmericaNorwayOECD membersOmanOther small statesPacific island small statesPakistanPanamaPapua New GuineaParaguayPeruPhilippinesPolandPortugalPost-demographic dividendPre-demographic dividendQatarRomaniaRussian FederationSamoaSaudi ArabiaSenegalSerbiaSingaporeSlovak RepublicSloveniaSmall statesSolomon IslandsSomaliaSouth AfricaSouth AsiaSouth Asia (IDA & IBRD)SpainSri LankaSt. Kitts and NevisSt. LuciaSt. Vincent and the GrenadinesSub-Saharan Africa Sub-Saharan Africa (excluding high income)Sub-Saharan Africa (IDA & IBRD countries)SurinameSwedenSwitzerlandTanzaniaThailandTogoTongaTrinidad and TobagoTunisiaTurkeyUgandaUkraineUnited Arab EmiratesUnited KingdomUnited StatesUpper middle incomeUruguayVanuatuVenezuela, RBVietnamWorldYemen, Rep.ZambiaZimbabwe Timeline:
This timeline shows a graph from 1961 to 2015 of Australia. No data until 1960. Number of actual observations by date: 55.
Source name:
World Development Indicators
Source organization:
World Bank staff estimates based data from International Monetary Fund's Direction of Trade database.
Categories, topics:
Private Sector, Trade
Last updated:
apr 23, 2017
Indicators value changes by year
Maximum:
35.801
jan 1, 2015
At the date of observation
Value
Absolute change
Change from previous value
jan 1, 1961
4.084
+4.084
0.0%
jan 1, 1962
4.328
+0.245
6.0%
jan 1, 1963
4.195
-0.133
-3.07%
jan 1, 1964
4.435
+0.239
5.7%
jan 1, 1965
4.109
-0.326
-7.35%
jan 1, 1966
3.919
-0.19
-4.62%
jan 1, 1967
4.647
+0.728
18.58%
jan 1, 1968
4.471
-0.176
-3.78%
jan 1, 1969
4.152
-0.319
-7.14%
jan 1, 1970
4.163
+0.011
0.26%
jan 1, 1971
3.315
-0.848
-20.37%
jan 1, 1972
3.127
-0.188
-5.67%
jan 1, 1973
3.391
+0.264
8.43%
jan 1, 1974
3.954
+0.564
16.63%
jan 1, 1975
3.456
-0.499
-12.61%
jan 1, 1976
3.057
-0.399
-11.53%
jan 1, 1977
3.815
+0.758
24.8%
jan 1, 1978
4.612
+0.797
20.88%
jan 1, 1979
4.402
-0.21
-4.55%
jan 1, 1980
4.995
+0.593
13.47%
jan 1, 1981
5.672
+0.676
13.54%
jan 1, 1982
5.546
-0.126
-2.21%
jan 1, 1983
6.33
+0.784
14.13%
jan 1, 1984
4.603
-1.727
-27.28%
jan 1, 1985
5.264
+0.661
14.37%
jan 1, 1986
4.523
-0.742
-14.09%
jan 1, 1987
5.004
+0.481
10.63%
jan 1, 1988
6.05
+1.046
20.91%
jan 1, 1989
6.125
+0.075
1.24%
jan 1, 1990
6.619
+0.494
8.07%
jan 1, 1991
7.234
+0.615
9.29%
jan 1, 1992
10.242
+3.008
41.58%
jan 1, 1993
12.338
+2.096
20.46%
jan 1, 1994
12.723
+0.385
3.12%
jan 1, 1995
12.307
-0.416
-3.27%
jan 1, 1996
12.6
+0.293
2.38%
jan 1, 1997
13.78
+1.18
9.36%
jan 1, 1998
15.211
+1.431
10.38%
jan 1, 1999
16.54
+1.329
8.74%
jan 1, 2000
17.74
+1.2
7.26%
jan 1, 2001
20.216
+2.476
13.96%
jan 1, 2002
21.265
+1.049
5.19%
jan 1, 2003
22.453
+1.187
5.58%
jan 1, 2004
24.006
+1.554
6.92%
jan 1, 2005
25.566
+1.56
6.5%
jan 1, 2006
27.185
+1.619
6.33%
jan 1, 2007
29.093
+1.907
7.02%
jan 1, 2008
30.467
+1.374
4.72%
jan 1, 2009
30.417
-0.05
-0.16%
jan 1, 2010
33.179
+2.762
9.08%
jan 1, 2011
34.119
+0.94
2.83%
jan 1, 2012
31.841
-2.278
-6.68%
jan 1, 2013
32.269
+0.429
1.35%
jan 1, 2014
33.975
+1.706
5.29%
jan 1, 2015
35.801
+1.825
5.37%
Ranking of countries by current statistics by years


Comments: