29
/
en
AIzaSyAYiBZKx7MnpbEhh9jyipgxe19OcubqV5w
April 1, 2024
281276
Venezuela, RB
VEN
true
2
1
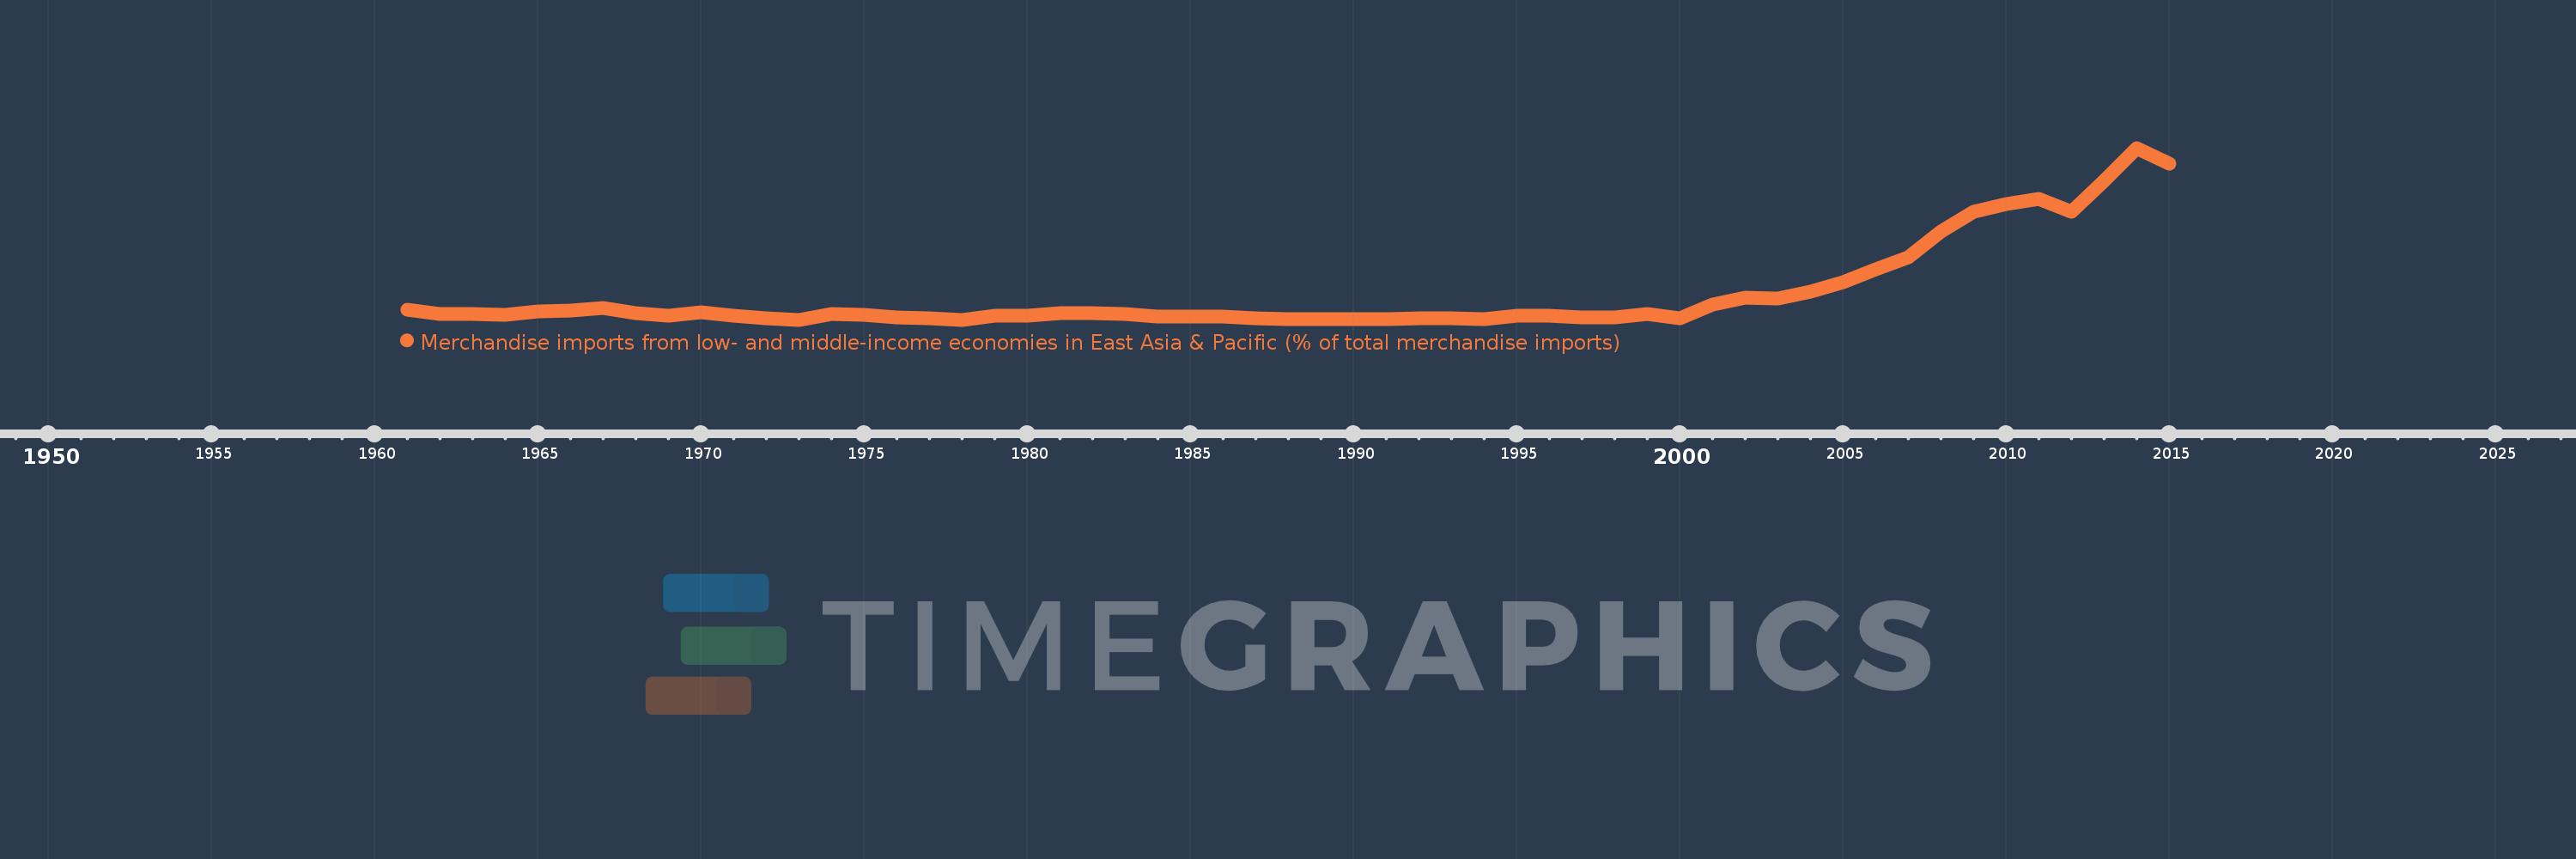
Merchandise imports from low- and middle-income economies in East Asia & Pacific (% of total merchandise imports)
2015,2014,2013,2012,2011,2010,2009,2008,2007,2006,2005,2004,2003,2002,2001,2000,1999,1998,1997,1996,1995,1994,1993,1992,1991,1990,1989,1988,1987,1986,1985,1984,1983,1982,1981,1980,1979,1978,1977,1976,1975,1974,1973,1972,1971,1970,1969,1968,1967,1966,1965,1964,1963,1962,1961
This statistics in other country:
AfghanistanAlbaniaAlgeriaArab WorldArgentinaArmeniaArubaAustraliaAustriaAzerbaijanBahamas, TheBahrainBangladeshBarbadosBelarusBelgiumBelizeBeninBermudaBoliviaBrazilBrunei DarussalamBulgariaBurkina FasoBurundiCabo VerdeCambodiaCameroonCanadaCaribbean small statesCentral African RepublicCentral Europe and the BalticsChileChinaColombiaCongo, Rep.Costa RicaCote d'IvoireCroatiaCyprusCzech RepublicDenmarkDominicaDominican RepublicEarly-demographic dividendEast Asia & PacificEast Asia & Pacific (excluding high income)East Asia & Pacific (IDA & IBRD countries)EcuadorEgypt, Arab Rep.El SalvadorEstoniaEthiopiaEuro areaEurope & Central AsiaEurope & Central Asia (excluding high income)Europe & Central Asia (IDA & IBRD countries)European UnionFijiFinlandFragile and conflict affected situationsFranceFrench PolynesiaGabonGambia, TheGeorgiaGermanyGhanaGreeceGreenlandGrenadaGuatemalaHaitiHeavily indebted poor countries (HIPC)High incomeHondurasHong Kong SAR, ChinaHungaryIBRD onlyIcelandIDA & IBRD totalIDA blendIDA onlyIDA totalIndiaIndonesiaIran, Islamic Rep.IraqIrelandIsraelItalyJamaicaJapanJordanKazakhstanKenyaKorea, Dem. People’s Rep.Korea, Rep.KuwaitKyrgyz RepublicLao PDRLate-demographic dividendLatin America & Caribbean Latin America & Caribbean (excluding high income)Latin America & the Caribbean (IDA & IBRD countries)LatviaLeast developed countries: UN classificationLebanonLithuaniaLow & middle incomeLow incomeLower middle incomeLuxembourgMacao SAR, ChinaMacedonia, FYRMadagascarMalaysiaMaliMaltaMauritiusMexicoMiddle East & North AfricaMiddle East & North Africa (excluding high income)Middle East & North Africa (IDA & IBRD countries)Middle incomeMoldovaMongoliaMontenegroMoroccoMyanmarNetherlandsNew CaledoniaNew ZealandNicaraguaNigerNigeriaNorth AmericaNorwayOECD membersOmanOther small statesPacific island small statesPakistanPanamaPapua New GuineaParaguayPeruPhilippinesPolandPortugalPost-demographic dividendPre-demographic dividendQatarRomaniaRussian FederationSamoaSaudi ArabiaSenegalSerbiaSingaporeSlovak RepublicSloveniaSmall statesSolomon IslandsSomaliaSouth AfricaSouth AsiaSouth Asia (IDA & IBRD)SpainSri LankaSt. Kitts and NevisSt. LuciaSt. Vincent and the GrenadinesSub-Saharan Africa Sub-Saharan Africa (excluding high income)Sub-Saharan Africa (IDA & IBRD countries)SurinameSwedenSwitzerlandTanzaniaThailandTogoTongaTrinidad and TobagoTunisiaTurkeyUgandaUkraineUnited Arab EmiratesUnited KingdomUnited StatesUpper middle incomeUruguayVanuatuVenezuela, RBVietnamWorldYemen, Rep.ZambiaZimbabwe Timeline:
This timeline shows a graph from 1961 to 2015 of Venezuela, RB. No data until 1960. Number of actual observations by date: 55.
Source name:
World Development Indicators
Source organization:
World Bank staff estimates based data from International Monetary Fund's Direction of Trade database.
Categories, topics:
Private Sector, Trade
Last updated:
apr 23, 2017
Indicators value changes by year
Maximum:
14.968
jan 1, 2014
At the date of observation
Value
Absolute change
Change from previous value
jan 1, 1961
0.925
+0.925
0.0%
jan 1, 1962
0.532
-0.393
-42.47%
jan 1, 1963
0.505
-0.027
-5.16%
jan 1, 1964
0.461
-0.044
-8.74%
jan 1, 1965
0.76
+0.3
65.02%
jan 1, 1966
0.846
+0.086
11.35%
jan 1, 1967
1.025
+0.178
21.05%
jan 1, 1968
0.596
-0.429
-41.87%
jan 1, 1969
0.397
-0.199
-33.39%
jan 1, 1970
0.705
+0.309
77.79%
jan 1, 1971
0.393
-0.312
-44.25%
jan 1, 1972
0.134
-0.259
-65.96%
jan 1, 1973
0.042
-0.092
-68.46%
jan 1, 1974
0.552
+0.509
1.21K%
jan 1, 1975
0.494
-0.058
-10.47%
jan 1, 1976
0.206
-0.287
-58.19%
jan 1, 1977
0.162
-0.045
-21.62%
jan 1, 1978
0.034
-0.128
-78.78%
jan 1, 1979
0.381
+0.346
1.01K%
jan 1, 1980
0.415
+0.034
9.04%
jan 1, 1981
0.575
+0.16
38.43%
jan 1, 1982
0.614
+0.039
6.83%
jan 1, 1983
0.532
-0.082
-13.32%
jan 1, 1984
0.328
-0.204
-38.3%
jan 1, 1985
0.328
0.0
-0.04%
jan 1, 1986
0.274
-0.054
-16.58%
jan 1, 1987
0.17
-0.104
-37.82%
jan 1, 1988
0.106
-0.064
-37.48%
jan 1, 1989
0.099
-0.008
-7.26%
jan 1, 1990
0.114
+0.015
15.31%
jan 1, 1991
0.081
-0.033
-29.22%
jan 1, 1992
0.145
+0.064
79.54%
jan 1, 1993
0.137
-0.008
-5.23%
jan 1, 1994
0.091
-0.046
-33.32%
jan 1, 1995
0.417
+0.326
356.6%
jan 1, 1996
0.419
+0.002
0.45%
jan 1, 1997
0.254
-0.166
-39.52%
jan 1, 1998
0.263
+0.009
3.55%
jan 1, 1999
0.501
+0.238
90.74%
jan 1, 2000
0.182
-0.319
-63.73%
jan 1, 2001
1.345
+1.164
640.7%
jan 1, 2002
1.961
+0.616
45.75%
jan 1, 2003
1.861
-0.1
-5.09%
jan 1, 2004
2.443
+0.582
31.27%
jan 1, 2005
3.292
+0.849
34.74%
jan 1, 2006
4.414
+1.122
34.09%
jan 1, 2007
5.453
+1.039
23.55%
jan 1, 2008
7.689
+2.236
41.01%
jan 1, 2009
9.401
+1.711
22.26%
jan 1, 2010
10.116
+0.715
7.61%
jan 1, 2011
10.525
+0.408
4.04%
jan 1, 2012
9.457
-1.068
-10.14%
jan 1, 2013
12.139
+2.682
28.36%
jan 1, 2014
14.968
+2.828
23.3%
jan 1, 2015
13.609
-1.359
-9.08%
Ranking of countries by current statistics by years


Comments: