29
/
en
AIzaSyAYiBZKx7MnpbEhh9jyipgxe19OcubqV5w
April 1, 2024
140680
Ghana
GHA
true
2
1
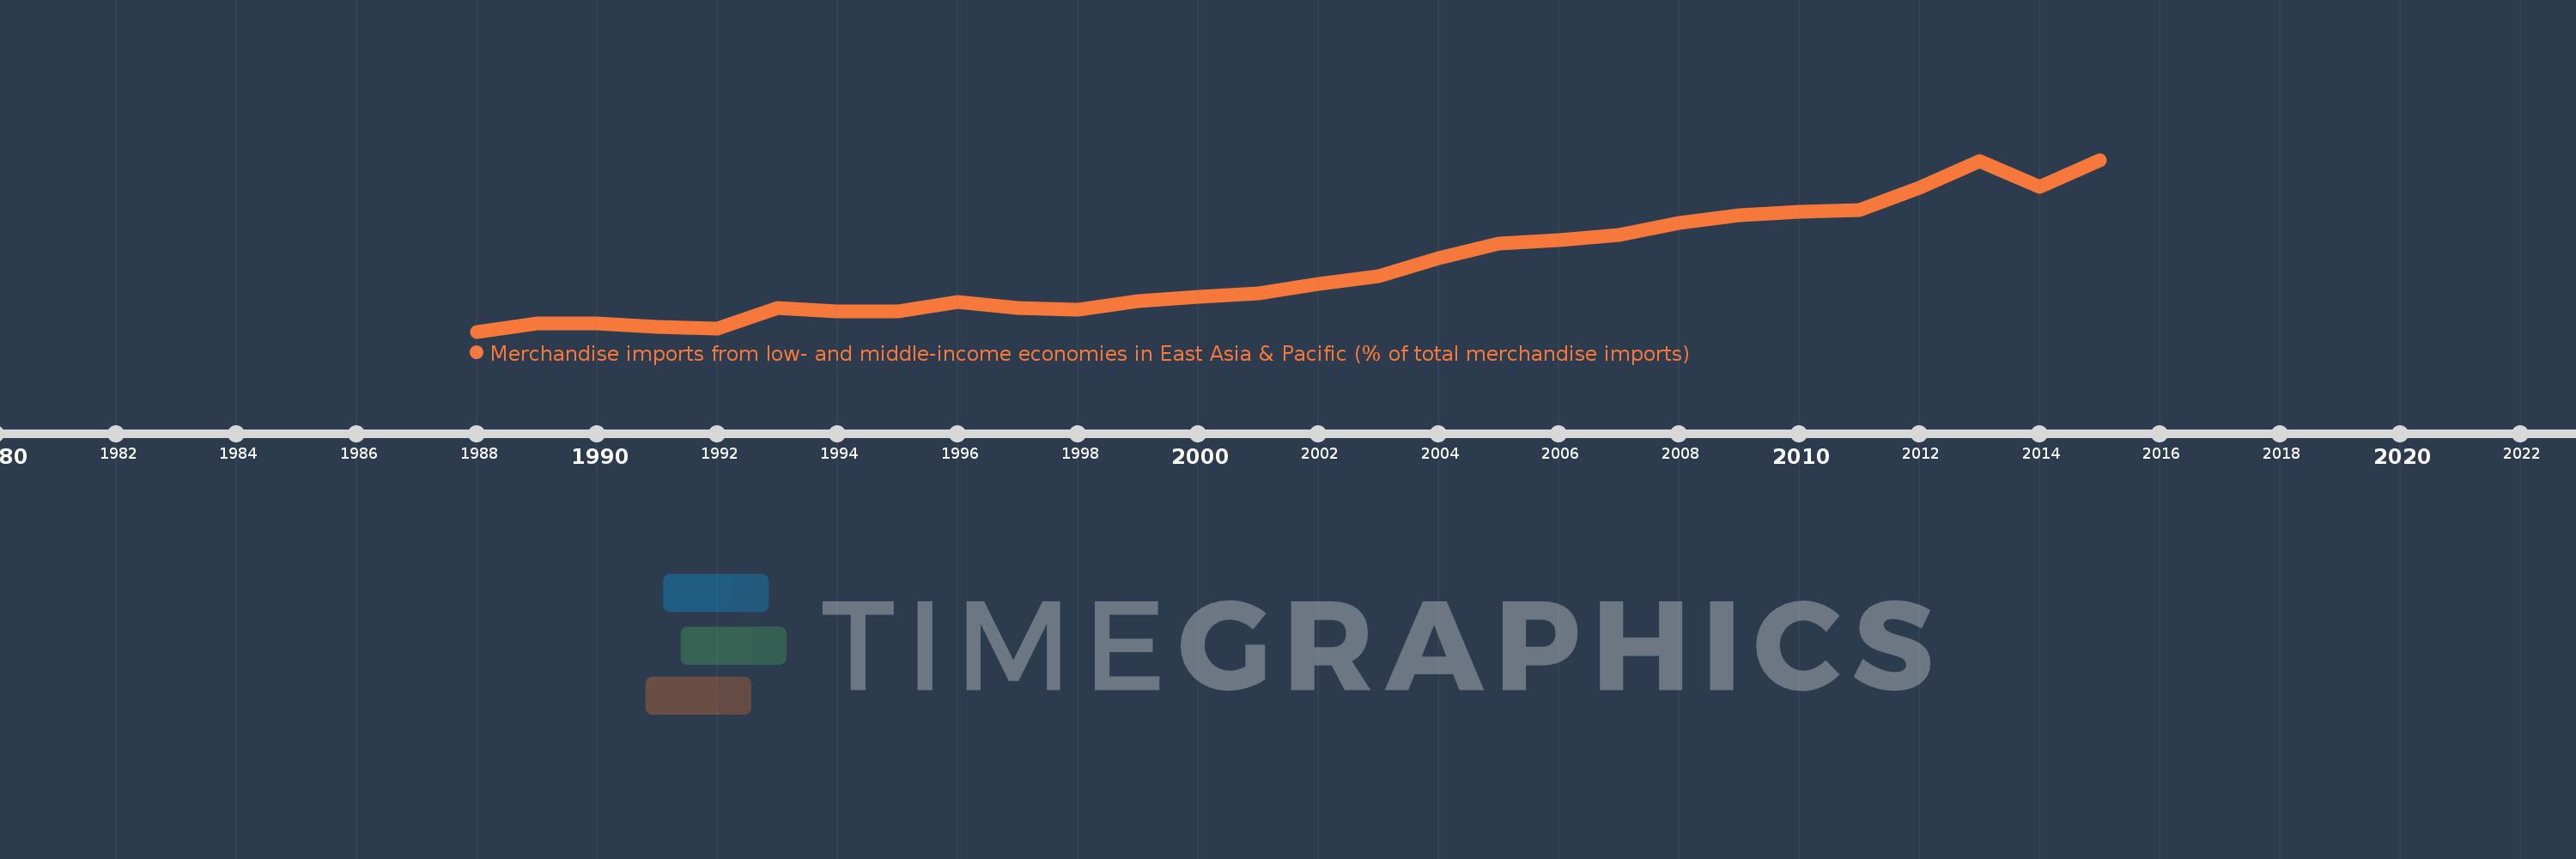
Merchandise imports from low- and middle-income economies in East Asia & Pacific (% of total merchandise imports)
2015,2014,2013,2012,2011,2010,2009,2008,2007,2006,2005,2004,2003,2002,2001,2000,1999,1998,1997,1996,1995,1994,1993,1992,1991,1990,1989,1988
This statistics in other country:
AfghanistanAlbaniaAlgeriaArab WorldArgentinaArmeniaArubaAustraliaAustriaAzerbaijanBahamas, TheBahrainBangladeshBarbadosBelarusBelgiumBelizeBeninBermudaBoliviaBrazilBrunei DarussalamBulgariaBurkina FasoBurundiCabo VerdeCambodiaCameroonCanadaCaribbean small statesCentral African RepublicCentral Europe and the BalticsChileChinaColombiaCongo, Rep.Costa RicaCote d'IvoireCroatiaCyprusCzech RepublicDenmarkDominicaDominican RepublicEarly-demographic dividendEast Asia & PacificEast Asia & Pacific (excluding high income)East Asia & Pacific (IDA & IBRD countries)EcuadorEgypt, Arab Rep.El SalvadorEstoniaEthiopiaEuro areaEurope & Central AsiaEurope & Central Asia (excluding high income)Europe & Central Asia (IDA & IBRD countries)European UnionFijiFinlandFragile and conflict affected situationsFranceFrench PolynesiaGabonGambia, TheGeorgiaGermanyGhanaGreeceGreenlandGrenadaGuatemalaHaitiHeavily indebted poor countries (HIPC)High incomeHondurasHong Kong SAR, ChinaHungaryIBRD onlyIcelandIDA & IBRD totalIDA blendIDA onlyIDA totalIndiaIndonesiaIran, Islamic Rep.IraqIrelandIsraelItalyJamaicaJapanJordanKazakhstanKenyaKorea, Dem. People’s Rep.Korea, Rep.KuwaitKyrgyz RepublicLao PDRLate-demographic dividendLatin America & Caribbean Latin America & Caribbean (excluding high income)Latin America & the Caribbean (IDA & IBRD countries)LatviaLeast developed countries: UN classificationLebanonLithuaniaLow & middle incomeLow incomeLower middle incomeLuxembourgMacao SAR, ChinaMacedonia, FYRMadagascarMalaysiaMaliMaltaMauritiusMexicoMiddle East & North AfricaMiddle East & North Africa (excluding high income)Middle East & North Africa (IDA & IBRD countries)Middle incomeMoldovaMongoliaMontenegroMoroccoMyanmarNetherlandsNew CaledoniaNew ZealandNicaraguaNigerNigeriaNorth AmericaNorwayOECD membersOmanOther small statesPacific island small statesPakistanPanamaPapua New GuineaParaguayPeruPhilippinesPolandPortugalPost-demographic dividendPre-demographic dividendQatarRomaniaRussian FederationSamoaSaudi ArabiaSenegalSerbiaSingaporeSlovak RepublicSloveniaSmall statesSolomon IslandsSomaliaSouth AfricaSouth AsiaSouth Asia (IDA & IBRD)SpainSri LankaSt. Kitts and NevisSt. LuciaSt. Vincent and the GrenadinesSub-Saharan Africa Sub-Saharan Africa (excluding high income)Sub-Saharan Africa (IDA & IBRD countries)SurinameSwedenSwitzerlandTanzaniaThailandTogoTongaTrinidad and TobagoTunisiaTurkeyUgandaUkraineUnited Arab EmiratesUnited KingdomUnited StatesUpper middle incomeUruguayVanuatuVenezuela, RBVietnamWorldYemen, Rep.ZambiaZimbabwe Timeline:
This timeline shows a graph from 1988 to 2015 of Ghana. No data until 1987. Number of actual observations by date: 28.
Source name:
World Development Indicators
Source organization:
World Bank staff estimates based data from International Monetary Fund's Direction of Trade database.
Categories, topics:
Private Sector, Trade
Last updated:
apr 23, 2017
Indicators value changes by year
Maximum:
31.094
jan 1, 2015
At the date of observation
Value
Absolute change
Change from previous value
jan 1, 1988
1.154
+1.154
0.0%
jan 1, 1989
2.573
+1.419
122.94%
jan 1, 1990
2.573
0.0
0.0%
jan 1, 1991
2.027
-0.546
-21.21%
jan 1, 1992
1.749
-0.278
-13.69%
jan 1, 1993
5.239
+3.49
199.47%
jan 1, 1994
4.607
-0.632
-12.06%
jan 1, 1995
4.634
+0.027
0.59%
jan 1, 1996
6.304
+1.67
36.04%
jan 1, 1997
5.34
-0.965
-15.3%
jan 1, 1998
5.023
-0.317
-5.94%
jan 1, 1999
6.423
+1.401
27.89%
jan 1, 2000
7.21
+0.786
12.24%
jan 1, 2001
7.768
+0.558
7.74%
jan 1, 2002
9.533
+1.766
22.73%
jan 1, 2003
10.84
+1.307
13.71%
jan 1, 2004
13.928
+3.088
28.48%
jan 1, 2005
16.516
+2.588
18.58%
jan 1, 2006
17.169
+0.653
3.96%
jan 1, 2007
17.996
+0.826
4.81%
jan 1, 2008
20.02
+2.024
11.25%
jan 1, 2009
21.492
+1.472
7.35%
jan 1, 2010
22.057
+0.565
2.63%
jan 1, 2011
22.304
+0.246
1.12%
jan 1, 2012
26.24
+3.936
17.65%
jan 1, 2013
30.944
+4.704
17.93%
jan 1, 2014
26.42
-4.524
-14.62%
jan 1, 2015
31.094
+4.674
17.69%
Ranking of countries by current statistics by years


Comments: