29
/
en
AIzaSyAYiBZKx7MnpbEhh9jyipgxe19OcubqV5w
April 1, 2024
209558
New Zealand
NZL
true
2
1
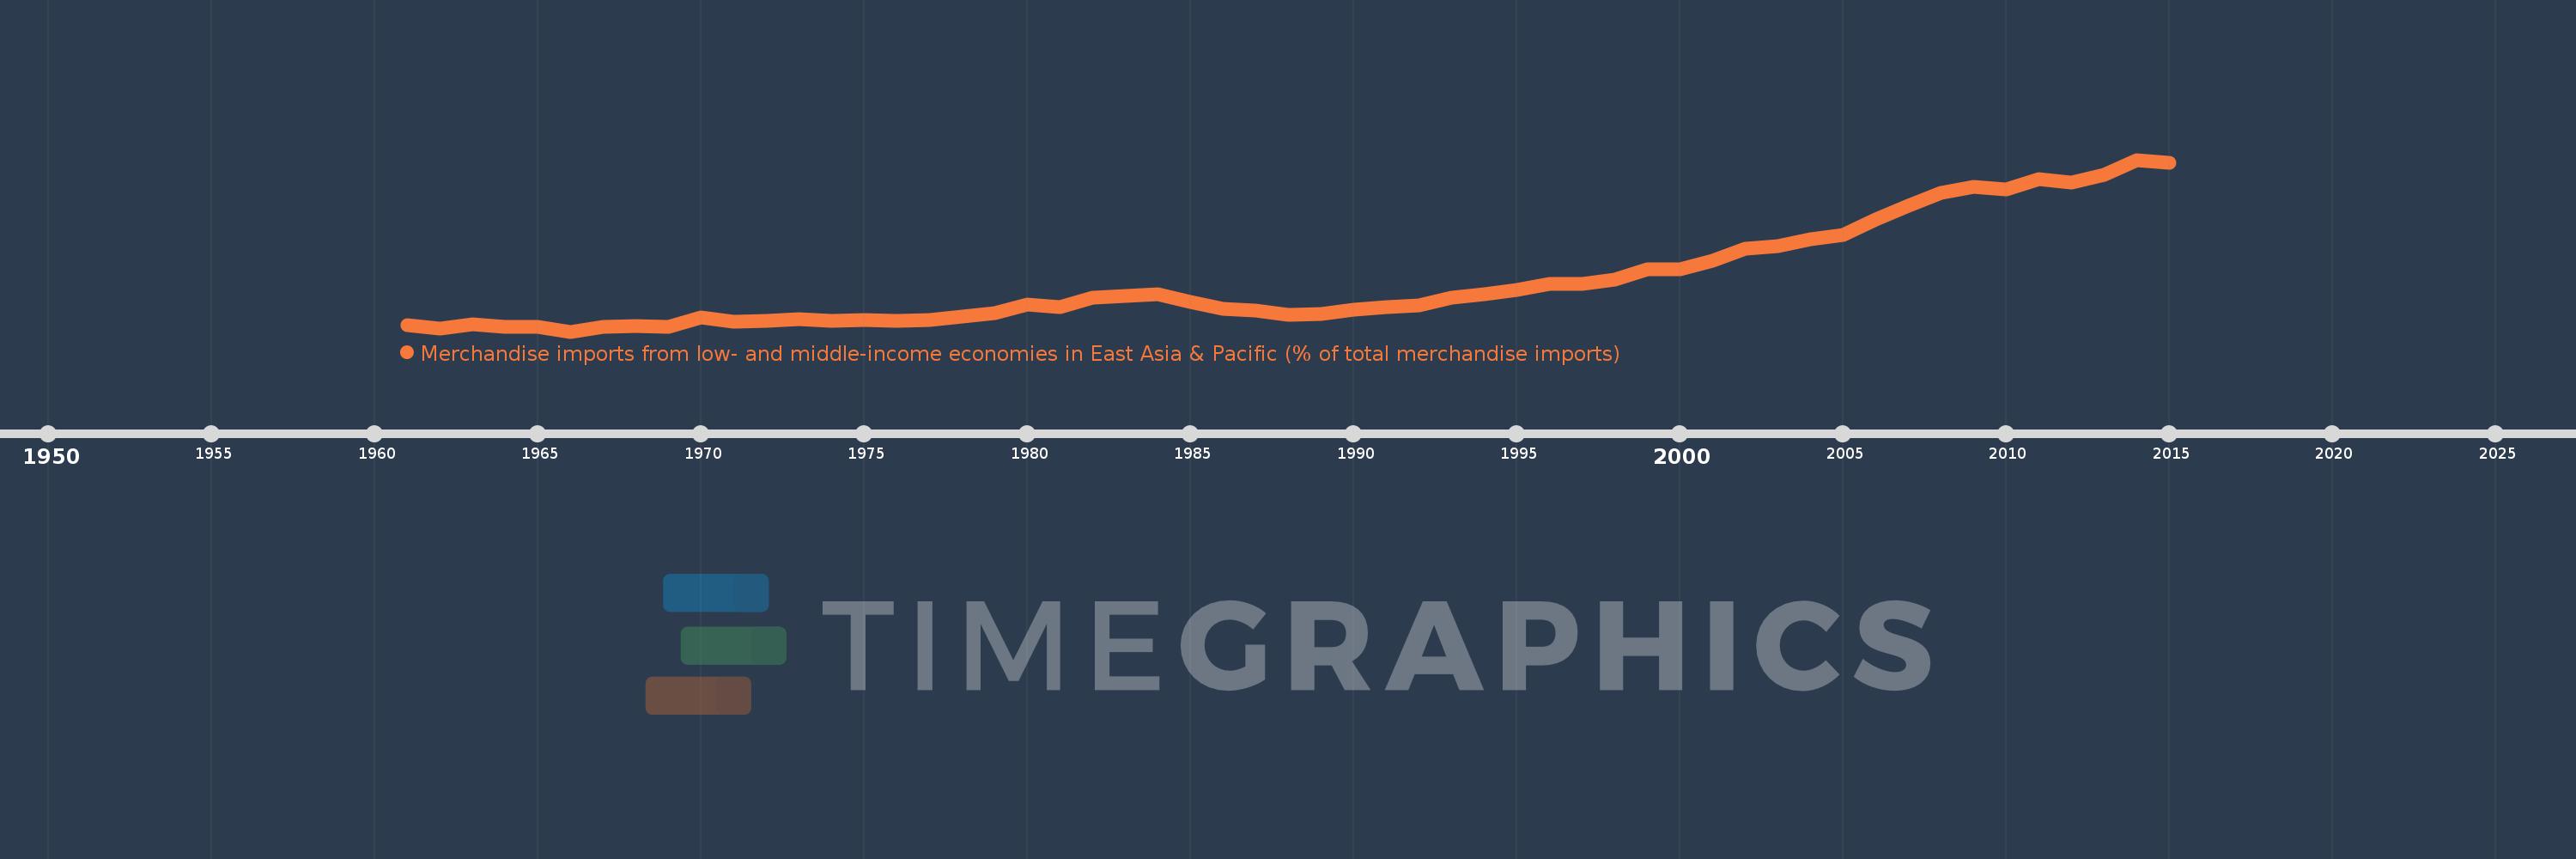
Merchandise imports from low- and middle-income economies in East Asia & Pacific (% of total merchandise imports)
2015,2014,2013,2012,2011,2010,2009,2008,2007,2006,2005,2004,2003,2002,2001,2000,1999,1998,1997,1996,1995,1994,1993,1992,1991,1990,1989,1988,1987,1986,1985,1984,1983,1982,1981,1980,1979,1978,1977,1976,1975,1974,1973,1972,1971,1970,1969,1968,1967,1966,1965,1964,1963,1962,1961
This statistics in other country:
AfghanistanAlbaniaAlgeriaArab WorldArgentinaArmeniaArubaAustraliaAustriaAzerbaijanBahamas, TheBahrainBangladeshBarbadosBelarusBelgiumBelizeBeninBermudaBoliviaBrazilBrunei DarussalamBulgariaBurkina FasoBurundiCabo VerdeCambodiaCameroonCanadaCaribbean small statesCentral African RepublicCentral Europe and the BalticsChileChinaColombiaCongo, Rep.Costa RicaCote d'IvoireCroatiaCyprusCzech RepublicDenmarkDominicaDominican RepublicEarly-demographic dividendEast Asia & PacificEast Asia & Pacific (excluding high income)East Asia & Pacific (IDA & IBRD countries)EcuadorEgypt, Arab Rep.El SalvadorEstoniaEthiopiaEuro areaEurope & Central AsiaEurope & Central Asia (excluding high income)Europe & Central Asia (IDA & IBRD countries)European UnionFijiFinlandFragile and conflict affected situationsFranceFrench PolynesiaGabonGambia, TheGeorgiaGermanyGhanaGreeceGreenlandGrenadaGuatemalaHaitiHeavily indebted poor countries (HIPC)High incomeHondurasHong Kong SAR, ChinaHungaryIBRD onlyIcelandIDA & IBRD totalIDA blendIDA onlyIDA totalIndiaIndonesiaIran, Islamic Rep.IraqIrelandIsraelItalyJamaicaJapanJordanKazakhstanKenyaKorea, Dem. People’s Rep.Korea, Rep.KuwaitKyrgyz RepublicLao PDRLate-demographic dividendLatin America & Caribbean Latin America & Caribbean (excluding high income)Latin America & the Caribbean (IDA & IBRD countries)LatviaLeast developed countries: UN classificationLebanonLithuaniaLow & middle incomeLow incomeLower middle incomeLuxembourgMacao SAR, ChinaMacedonia, FYRMadagascarMalaysiaMaliMaltaMauritiusMexicoMiddle East & North AfricaMiddle East & North Africa (excluding high income)Middle East & North Africa (IDA & IBRD countries)Middle incomeMoldovaMongoliaMontenegroMoroccoMyanmarNetherlandsNew CaledoniaNew ZealandNicaraguaNigerNigeriaNorth AmericaNorwayOECD membersOmanOther small statesPacific island small statesPakistanPanamaPapua New GuineaParaguayPeruPhilippinesPolandPortugalPost-demographic dividendPre-demographic dividendQatarRomaniaRussian FederationSamoaSaudi ArabiaSenegalSerbiaSingaporeSlovak RepublicSloveniaSmall statesSolomon IslandsSomaliaSouth AfricaSouth AsiaSouth Asia (IDA & IBRD)SpainSri LankaSt. Kitts and NevisSt. LuciaSt. Vincent and the GrenadinesSub-Saharan Africa Sub-Saharan Africa (excluding high income)Sub-Saharan Africa (IDA & IBRD countries)SurinameSwedenSwitzerlandTanzaniaThailandTogoTongaTrinidad and TobagoTunisiaTurkeyUgandaUkraineUnited Arab EmiratesUnited KingdomUnited StatesUpper middle incomeUruguayVanuatuVenezuela, RBVietnamWorldYemen, Rep.ZambiaZimbabwe Timeline:
This timeline shows a graph from 1961 to 2015 of New Zealand. No data until 1960. Number of actual observations by date: 55.
Source name:
World Development Indicators
Source organization:
World Bank staff estimates based data from International Monetary Fund's Direction of Trade database.
Categories, topics:
Private Sector, Trade
Last updated:
apr 23, 2017
Indicators value changes by year
Maximum:
28.452
jan 1, 2014
At the date of observation
Value
Absolute change
Change from previous value
jan 1, 1961
1.511
+1.511
0.0%
jan 1, 1962
0.979
-0.532
-35.22%
jan 1, 1963
1.686
+0.707
72.24%
jan 1, 1964
1.252
-0.434
-25.76%
jan 1, 1965
1.243
-0.009
-0.72%
jan 1, 1966
0.491
-0.751
-60.46%
jan 1, 1967
1.302
+0.811
164.95%
jan 1, 1968
1.454
+0.152
11.67%
jan 1, 1969
1.297
-0.157
-10.8%
jan 1, 1970
2.743
+1.446
111.48%
jan 1, 1971
2.167
-0.576
-21.0%
jan 1, 1972
2.19
+0.023
1.08%
jan 1, 1973
2.505
+0.315
14.38%
jan 1, 1974
2.228
-0.277
-11.07%
jan 1, 1975
2.407
+0.18
8.07%
jan 1, 1976
2.286
-0.121
-5.04%
jan 1, 1977
2.423
+0.137
5.99%
jan 1, 1978
2.883
+0.46
18.97%
jan 1, 1979
3.488
+0.605
21.0%
jan 1, 1980
4.893
+1.405
40.29%
jan 1, 1981
4.53
-0.364
-7.43%
jan 1, 1982
5.969
+1.439
31.77%
jan 1, 1983
6.345
+0.376
6.3%
jan 1, 1984
6.564
+0.219
3.46%
jan 1, 1985
5.317
-1.247
-19.0%
jan 1, 1986
4.174
-1.143
-21.5%
jan 1, 1987
3.954
-0.22
-5.27%
jan 1, 1988
3.174
-0.78
-19.74%
jan 1, 1989
3.413
+0.24
7.55%
jan 1, 1990
4.092
+0.679
19.88%
jan 1, 1991
4.515
+0.423
10.34%
jan 1, 1992
4.709
+0.194
4.29%
jan 1, 1993
5.989
+1.281
27.2%
jan 1, 1994
6.604
+0.615
10.27%
jan 1, 1995
7.213
+0.609
9.22%
jan 1, 1996
8.195
+0.981
13.6%
jan 1, 1997
8.277
+0.082
1.0%
jan 1, 1998
9.004
+0.727
8.78%
jan 1, 1999
10.632
+1.629
18.09%
jan 1, 2000
10.677
+0.044
0.42%
jan 1, 2001
12.085
+1.408
13.19%
jan 1, 2002
13.999
+1.914
15.84%
jan 1, 2003
14.395
+0.396
2.83%
jan 1, 2004
15.522
+1.127
7.83%
jan 1, 2005
16.27
+0.748
4.82%
jan 1, 2006
18.695
+2.425
14.9%
jan 1, 2007
21.016
+2.321
12.42%
jan 1, 2008
23.1
+2.084
9.92%
jan 1, 2009
24.037
+0.937
4.06%
jan 1, 2010
23.639
-0.399
-1.66%
jan 1, 2011
25.314
+1.676
7.09%
jan 1, 2012
24.704
-0.61
-2.41%
jan 1, 2013
25.974
+1.27
5.14%
jan 1, 2014
28.452
+2.478
9.54%
jan 1, 2015
27.977
-0.475
-1.67%
Ranking of countries by current statistics by years


Comments: