29
/
en
AIzaSyAYiBZKx7MnpbEhh9jyipgxe19OcubqV5w
April 1, 2024
27483
East Asia & Pacific
EAS
false
2
1
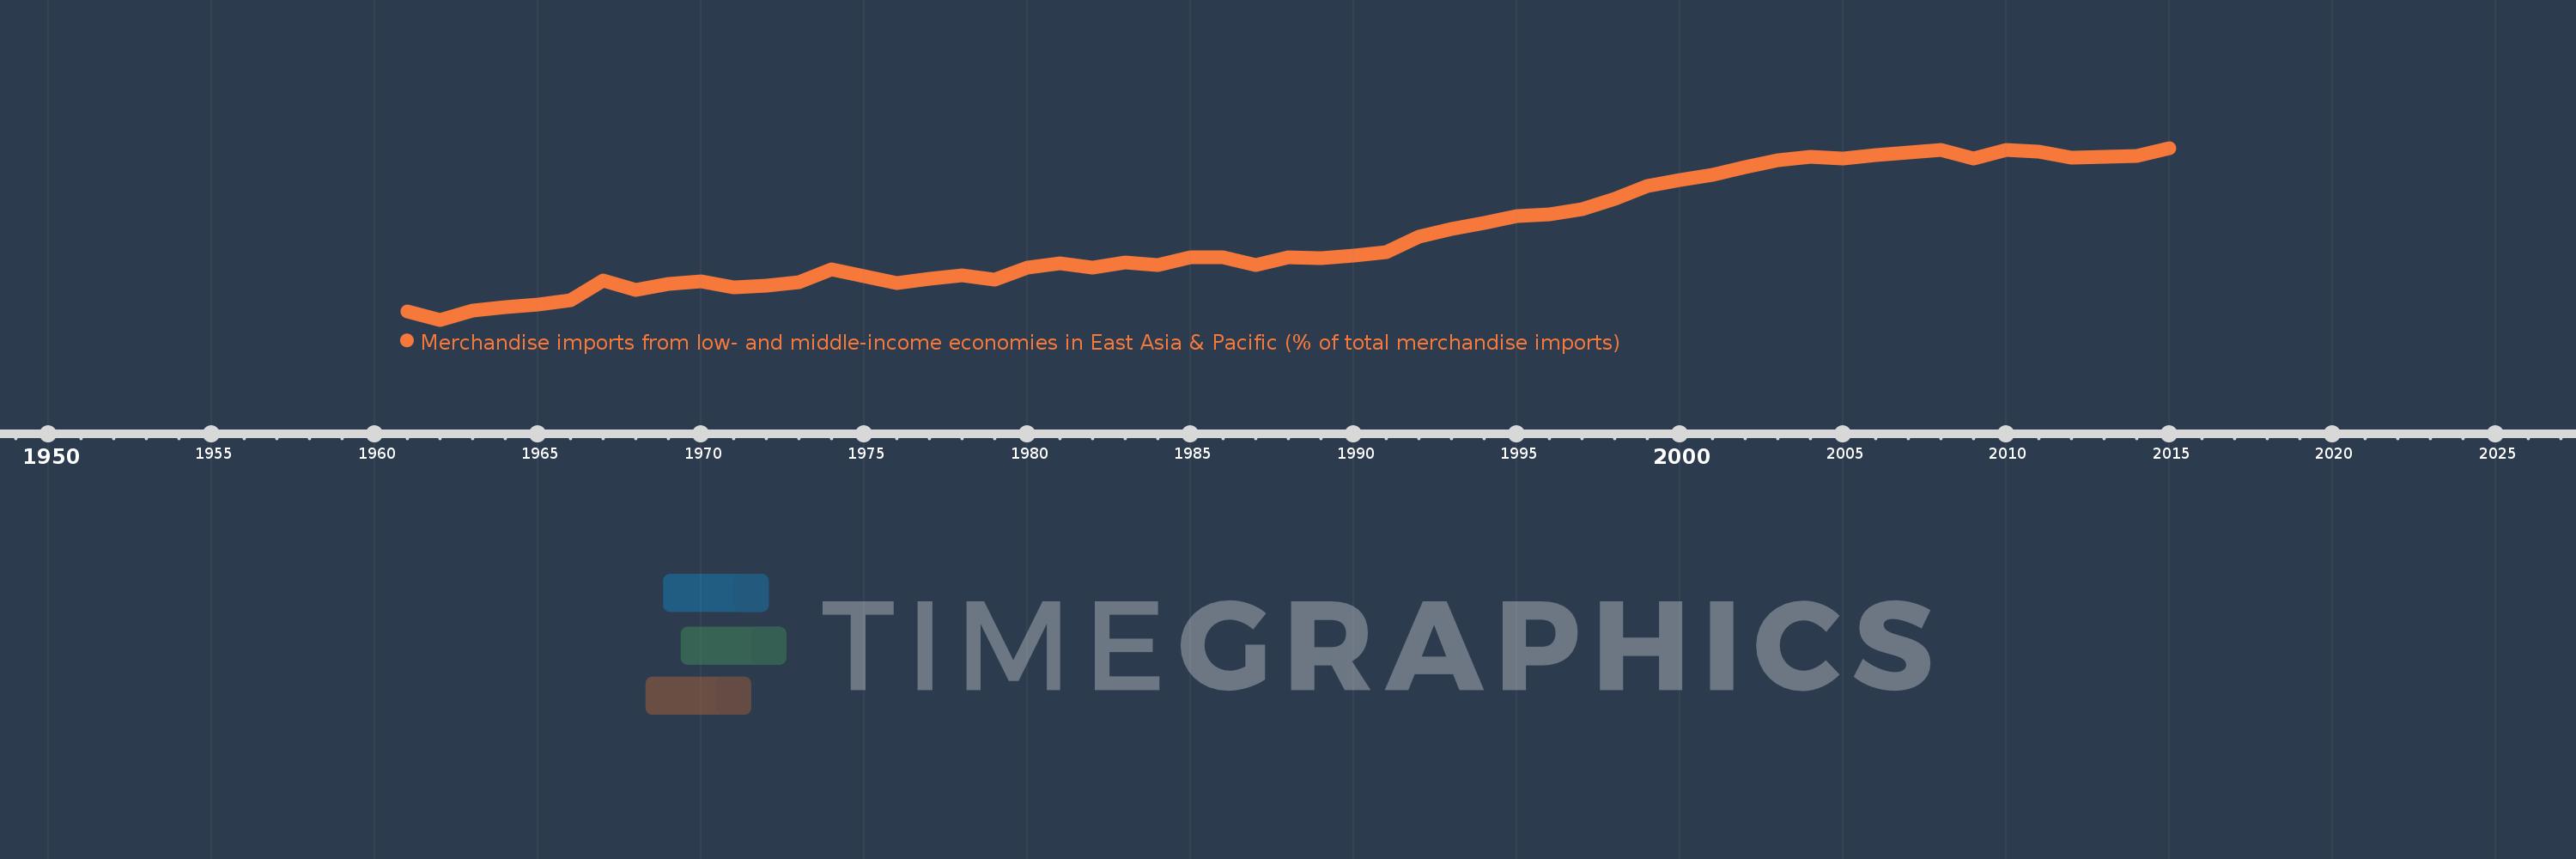
Merchandise imports from low- and middle-income economies in East Asia & Pacific (% of total merchandise imports)
2015,2014,2013,2012,2011,2010,2009,2008,2007,2006,2005,2004,2003,2002,2001,2000,1999,1998,1997,1996,1995,1994,1993,1992,1991,1990,1989,1988,1987,1986,1985,1984,1983,1982,1981,1980,1979,1978,1977,1976,1975,1974,1973,1972,1971,1970,1969,1968,1967,1966,1965,1964,1963,1962,1961
This statistics in other country:
AfghanistanAlbaniaAlgeriaArab WorldArgentinaArmeniaArubaAustraliaAustriaAzerbaijanBahamas, TheBahrainBangladeshBarbadosBelarusBelgiumBelizeBeninBermudaBoliviaBrazilBrunei DarussalamBulgariaBurkina FasoBurundiCabo VerdeCambodiaCameroonCanadaCaribbean small statesCentral African RepublicCentral Europe and the BalticsChileChinaColombiaCongo, Rep.Costa RicaCote d'IvoireCroatiaCyprusCzech RepublicDenmarkDominicaDominican RepublicEarly-demographic dividendEast Asia & PacificEast Asia & Pacific (excluding high income)East Asia & Pacific (IDA & IBRD countries)EcuadorEgypt, Arab Rep.El SalvadorEstoniaEthiopiaEuro areaEurope & Central AsiaEurope & Central Asia (excluding high income)Europe & Central Asia (IDA & IBRD countries)European UnionFijiFinlandFragile and conflict affected situationsFranceFrench PolynesiaGabonGambia, TheGeorgiaGermanyGhanaGreeceGreenlandGrenadaGuatemalaHaitiHeavily indebted poor countries (HIPC)High incomeHondurasHong Kong SAR, ChinaHungaryIBRD onlyIcelandIDA & IBRD totalIDA blendIDA onlyIDA totalIndiaIndonesiaIran, Islamic Rep.IraqIrelandIsraelItalyJamaicaJapanJordanKazakhstanKenyaKorea, Dem. People’s Rep.Korea, Rep.KuwaitKyrgyz RepublicLao PDRLate-demographic dividendLatin America & Caribbean Latin America & Caribbean (excluding high income)Latin America & the Caribbean (IDA & IBRD countries)LatviaLeast developed countries: UN classificationLebanonLithuaniaLow & middle incomeLow incomeLower middle incomeLuxembourgMacao SAR, ChinaMacedonia, FYRMadagascarMalaysiaMaliMaltaMauritiusMexicoMiddle East & North AfricaMiddle East & North Africa (excluding high income)Middle East & North Africa (IDA & IBRD countries)Middle incomeMoldovaMongoliaMontenegroMoroccoMyanmarNetherlandsNew CaledoniaNew ZealandNicaraguaNigerNigeriaNorth AmericaNorwayOECD membersOmanOther small statesPacific island small statesPakistanPanamaPapua New GuineaParaguayPeruPhilippinesPolandPortugalPost-demographic dividendPre-demographic dividendQatarRomaniaRussian FederationSamoaSaudi ArabiaSenegalSerbiaSingaporeSlovak RepublicSloveniaSmall statesSolomon IslandsSomaliaSouth AfricaSouth AsiaSouth Asia (IDA & IBRD)SpainSri LankaSt. Kitts and NevisSt. LuciaSt. Vincent and the GrenadinesSub-Saharan Africa Sub-Saharan Africa (excluding high income)Sub-Saharan Africa (IDA & IBRD countries)SurinameSwedenSwitzerlandTanzaniaThailandTogoTongaTrinidad and TobagoTunisiaTurkeyUgandaUkraineUnited Arab EmiratesUnited KingdomUnited StatesUpper middle incomeUruguayVanuatuVenezuela, RBVietnamWorldYemen, Rep.ZambiaZimbabwe Timeline:
This timeline shows a graph from 1961 to 2015 of East Asia & Pacific. No data until 1960. Number of actual observations by date: 55.
Source name:
World Development Indicators
Source organization:
World Bank staff estimates based data from International Monetary Fund's Direction of Trade database.
Categories, topics:
Private Sector, Trade
Last updated:
apr 23, 2017
Indicators value changes by year
Maximum:
26.701
jan 1, 2015
At the date of observation
Value
Absolute change
Change from previous value
jan 1, 1961
7.463
+7.463
0.0%
jan 1, 1962
6.474
-0.989
-13.25%
jan 1, 1963
7.512
+1.038
16.03%
jan 1, 1964
7.941
+0.429
5.71%
jan 1, 1965
8.239
+0.298
3.75%
jan 1, 1966
8.808
+0.569
6.91%
jan 1, 1967
11.084
+2.277
25.85%
jan 1, 1968
10.011
-1.074
-9.69%
jan 1, 1969
10.724
+0.714
7.13%
jan 1, 1970
11.035
+0.31
2.89%
jan 1, 1971
10.279
-0.756
-6.85%
jan 1, 1972
10.469
+0.19
1.85%
jan 1, 1973
10.938
+0.469
4.48%
jan 1, 1974
12.37
+1.433
13.1%
jan 1, 1975
11.629
-0.741
-5.99%
jan 1, 1976
10.834
-0.795
-6.84%
jan 1, 1977
11.261
+0.427
3.94%
jan 1, 1978
11.667
+0.407
3.61%
jan 1, 1979
11.159
-0.508
-4.35%
jan 1, 1980
12.566
+1.406
12.6%
jan 1, 1981
13.137
+0.571
4.55%
jan 1, 1982
12.627
-0.511
-3.89%
jan 1, 1983
13.179
+0.553
4.38%
jan 1, 1984
12.877
-0.302
-2.29%
jan 1, 1985
13.821
+0.944
7.33%
jan 1, 1986
13.782
-0.039
-0.28%
jan 1, 1987
12.907
-0.875
-6.35%
jan 1, 1988
13.872
+0.966
7.48%
jan 1, 1989
13.729
-0.143
-1.03%
jan 1, 1990
13.981
+0.252
1.84%
jan 1, 1991
14.45
+0.469
3.35%
jan 1, 1992
16.298
+1.847
12.78%
jan 1, 1993
17.155
+0.858
5.26%
jan 1, 1994
17.901
+0.745
4.34%
jan 1, 1995
18.69
+0.789
4.41%
jan 1, 1996
18.871
+0.181
0.97%
jan 1, 1997
19.51
+0.639
3.38%
jan 1, 1998
20.697
+1.187
6.09%
jan 1, 1999
22.21
+1.513
7.31%
jan 1, 2000
22.913
+0.703
3.17%
jan 1, 2001
23.486
+0.573
2.5%
jan 1, 2002
24.414
+0.927
3.95%
jan 1, 2003
25.267
+0.853
3.5%
jan 1, 2004
25.641
+0.373
1.48%
jan 1, 2005
25.446
-0.195
-0.76%
jan 1, 2006
25.871
+0.425
1.67%
jan 1, 2007
26.16
+0.289
1.12%
jan 1, 2008
26.433
+0.272
1.04%
jan 1, 2009
25.428
-1.004
-3.8%
jan 1, 2010
26.431
+1.003
3.94%
jan 1, 2011
26.239
-0.192
-0.73%
jan 1, 2012
25.521
-0.718
-2.73%
jan 1, 2013
25.7
+0.178
0.7%
jan 1, 2014
25.785
+0.086
0.33%
jan 1, 2015
26.701
+0.916
3.55%
Ranking of countries by current statistics by years


Comments: