29
/
en
AIzaSyAYiBZKx7MnpbEhh9jyipgxe19OcubqV5w
April 1, 2024
183139
Macao SAR, China
MAC
true
2
1
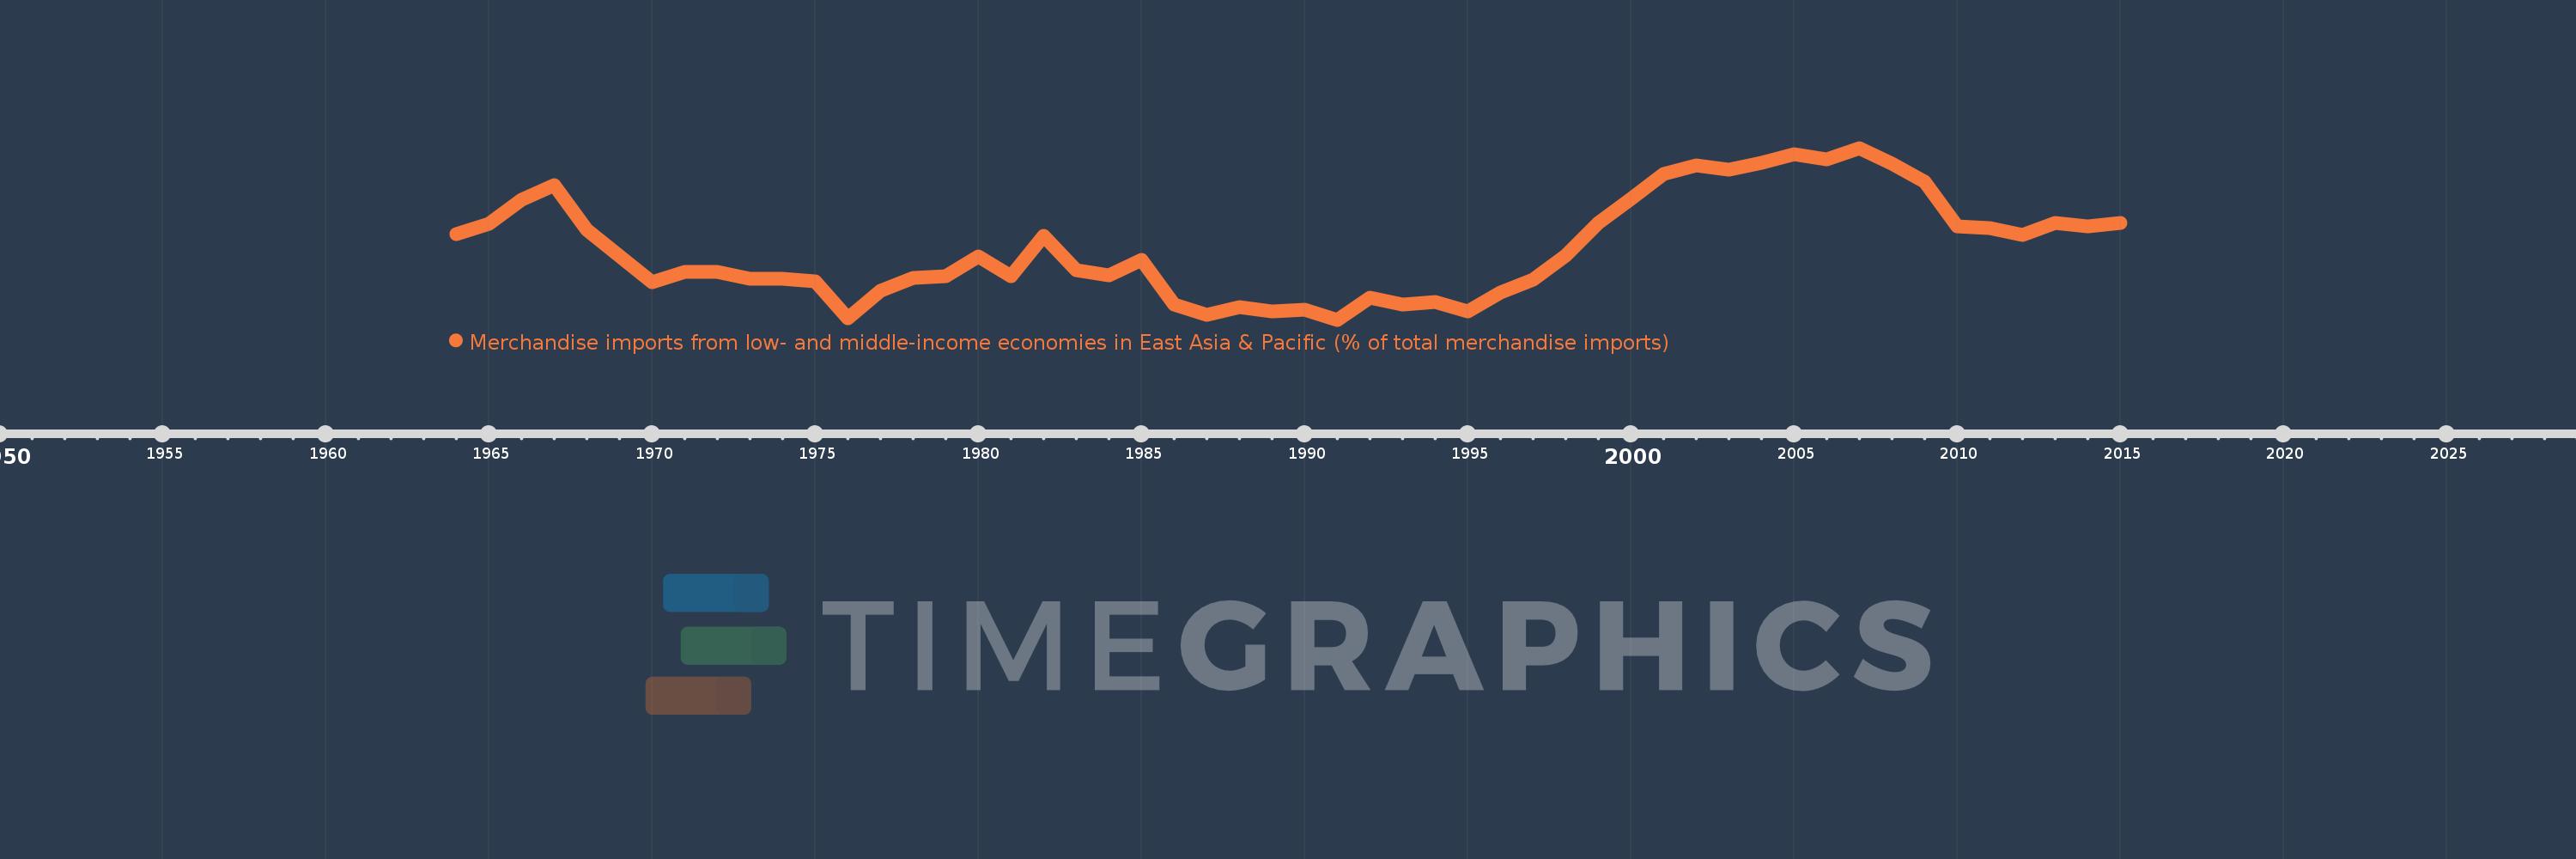
Merchandise imports from low- and middle-income economies in East Asia & Pacific (% of total merchandise imports)
2015,2014,2013,2012,2011,2010,2009,2008,2007,2006,2005,2004,2003,2002,2001,2000,1999,1998,1997,1996,1995,1994,1993,1992,1991,1990,1989,1988,1987,1986,1985,1984,1983,1982,1981,1980,1979,1978,1977,1976,1975,1974,1973,1972,1971,1970,1968,1967,1966,1965,1964
This statistics in other country:
AfghanistanAlbaniaAlgeriaArab WorldArgentinaArmeniaArubaAustraliaAustriaAzerbaijanBahamas, TheBahrainBangladeshBarbadosBelarusBelgiumBelizeBeninBermudaBoliviaBrazilBrunei DarussalamBulgariaBurkina FasoBurundiCabo VerdeCambodiaCameroonCanadaCaribbean small statesCentral African RepublicCentral Europe and the BalticsChileChinaColombiaCongo, Rep.Costa RicaCote d'IvoireCroatiaCyprusCzech RepublicDenmarkDominicaDominican RepublicEarly-demographic dividendEast Asia & PacificEast Asia & Pacific (excluding high income)East Asia & Pacific (IDA & IBRD countries)EcuadorEgypt, Arab Rep.El SalvadorEstoniaEthiopiaEuro areaEurope & Central AsiaEurope & Central Asia (excluding high income)Europe & Central Asia (IDA & IBRD countries)European UnionFijiFinlandFragile and conflict affected situationsFranceFrench PolynesiaGabonGambia, TheGeorgiaGermanyGhanaGreeceGreenlandGrenadaGuatemalaHaitiHeavily indebted poor countries (HIPC)High incomeHondurasHong Kong SAR, ChinaHungaryIBRD onlyIcelandIDA & IBRD totalIDA blendIDA onlyIDA totalIndiaIndonesiaIran, Islamic Rep.IraqIrelandIsraelItalyJamaicaJapanJordanKazakhstanKenyaKorea, Dem. People’s Rep.Korea, Rep.KuwaitKyrgyz RepublicLao PDRLate-demographic dividendLatin America & Caribbean Latin America & Caribbean (excluding high income)Latin America & the Caribbean (IDA & IBRD countries)LatviaLeast developed countries: UN classificationLebanonLithuaniaLow & middle incomeLow incomeLower middle incomeLuxembourgMacao SAR, ChinaMacedonia, FYRMadagascarMalaysiaMaliMaltaMauritiusMexicoMiddle East & North AfricaMiddle East & North Africa (excluding high income)Middle East & North Africa (IDA & IBRD countries)Middle incomeMoldovaMongoliaMontenegroMoroccoMyanmarNetherlandsNew CaledoniaNew ZealandNicaraguaNigerNigeriaNorth AmericaNorwayOECD membersOmanOther small statesPacific island small statesPakistanPanamaPapua New GuineaParaguayPeruPhilippinesPolandPortugalPost-demographic dividendPre-demographic dividendQatarRomaniaRussian FederationSamoaSaudi ArabiaSenegalSerbiaSingaporeSlovak RepublicSloveniaSmall statesSolomon IslandsSomaliaSouth AfricaSouth AsiaSouth Asia (IDA & IBRD)SpainSri LankaSt. Kitts and NevisSt. LuciaSt. Vincent and the GrenadinesSub-Saharan Africa Sub-Saharan Africa (excluding high income)Sub-Saharan Africa (IDA & IBRD countries)SurinameSwedenSwitzerlandTanzaniaThailandTogoTongaTrinidad and TobagoTunisiaTurkeyUgandaUkraineUnited Arab EmiratesUnited KingdomUnited StatesUpper middle incomeUruguayVanuatuVenezuela, RBVietnamWorldYemen, Rep.ZambiaZimbabwe Timeline:
This timeline shows a graph from 1964 to 2015 of Macao SAR, China. No data until 1963. Number of actual observations by date: 51.
Source name:
World Development Indicators
Source organization:
World Bank staff estimates based data from International Monetary Fund's Direction of Trade database.
Categories, topics:
Private Sector, Trade
Last updated:
apr 23, 2017
Indicators value changes by year
Minimum:
19.334
jan 1, 1991
Maximum:
48.345
jan 1, 2007
At the date of observation
Value
Absolute change
Change from previous value
jan 1, 1964
33.813
+33.813
0.0%
jan 1, 1965
35.491
+1.678
4.96%
jan 1, 1966
39.53
+4.039
11.38%
jan 1, 1967
42.043
+2.513
6.36%
jan 1, 1968
34.588
-7.455
-17.73%
jan 1, 1970
25.703
-8.886
-25.69%
jan 1, 1971
27.475
+1.773
6.9%
jan 1, 1972
27.448
-0.027
-0.1%
jan 1, 1973
26.313
-1.135
-4.14%
jan 1, 1974
26.216
-0.097
-0.37%
jan 1, 1975
25.827
-0.388
-1.48%
jan 1, 1976
19.546
-6.281
-24.32%
jan 1, 1977
24.208
+4.661
23.85%
jan 1, 1978
26.376
+2.169
8.96%
jan 1, 1979
26.703
+0.327
1.24%
jan 1, 1980
30.033
+3.33
12.47%
jan 1, 1981
26.667
-3.367
-11.21%
jan 1, 1982
33.456
+6.789
25.46%
jan 1, 1983
27.683
-5.774
-17.26%
jan 1, 1984
26.794
-0.889
-3.21%
jan 1, 1985
29.508
+2.714
10.13%
jan 1, 1986
21.856
-7.652
-25.93%
jan 1, 1987
20.177
-1.679
-7.68%
jan 1, 1988
21.479
+1.302
6.45%
jan 1, 1989
20.769
-0.71
-3.31%
jan 1, 1990
20.975
+0.207
0.99%
jan 1, 1991
19.334
-1.642
-7.83%
jan 1, 1992
23.007
+3.673
19.0%
jan 1, 1993
21.914
-1.093
-4.75%
jan 1, 1994
22.306
+0.393
1.79%
jan 1, 1995
20.751
-1.555
-6.97%
jan 1, 1996
23.889
+3.137
15.12%
jan 1, 1997
26.047
+2.159
9.04%
jan 1, 1998
30.237
+4.189
16.08%
jan 1, 1999
35.671
+5.434
17.97%
jan 1, 2000
39.801
+4.131
11.58%
jan 1, 2001
44.007
+4.206
10.57%
jan 1, 2002
45.38
+1.373
3.12%
jan 1, 2003
44.73
-0.65
-1.43%
jan 1, 2004
45.887
+1.157
2.59%
jan 1, 2005
47.242
+1.355
2.95%
jan 1, 2006
46.467
-0.775
-1.64%
jan 1, 2007
48.345
+1.878
4.04%
jan 1, 2008
45.693
-2.652
-5.49%
jan 1, 2009
42.691
-3.002
-6.57%
jan 1, 2010
35.125
-7.566
-17.72%
jan 1, 2011
34.839
-0.287
-0.82%
jan 1, 2012
33.722
-1.117
-3.2%
jan 1, 2013
35.623
+1.901
5.64%
jan 1, 2014
35.143
-0.48
-1.35%
jan 1, 2015
35.73
+0.587
1.67%
Ranking of countries by current statistics by years


Comments: