29
/
en
AIzaSyAYiBZKx7MnpbEhh9jyipgxe19OcubqV5w
April 1, 2024
269627
Turkey
TUR
true
2
1
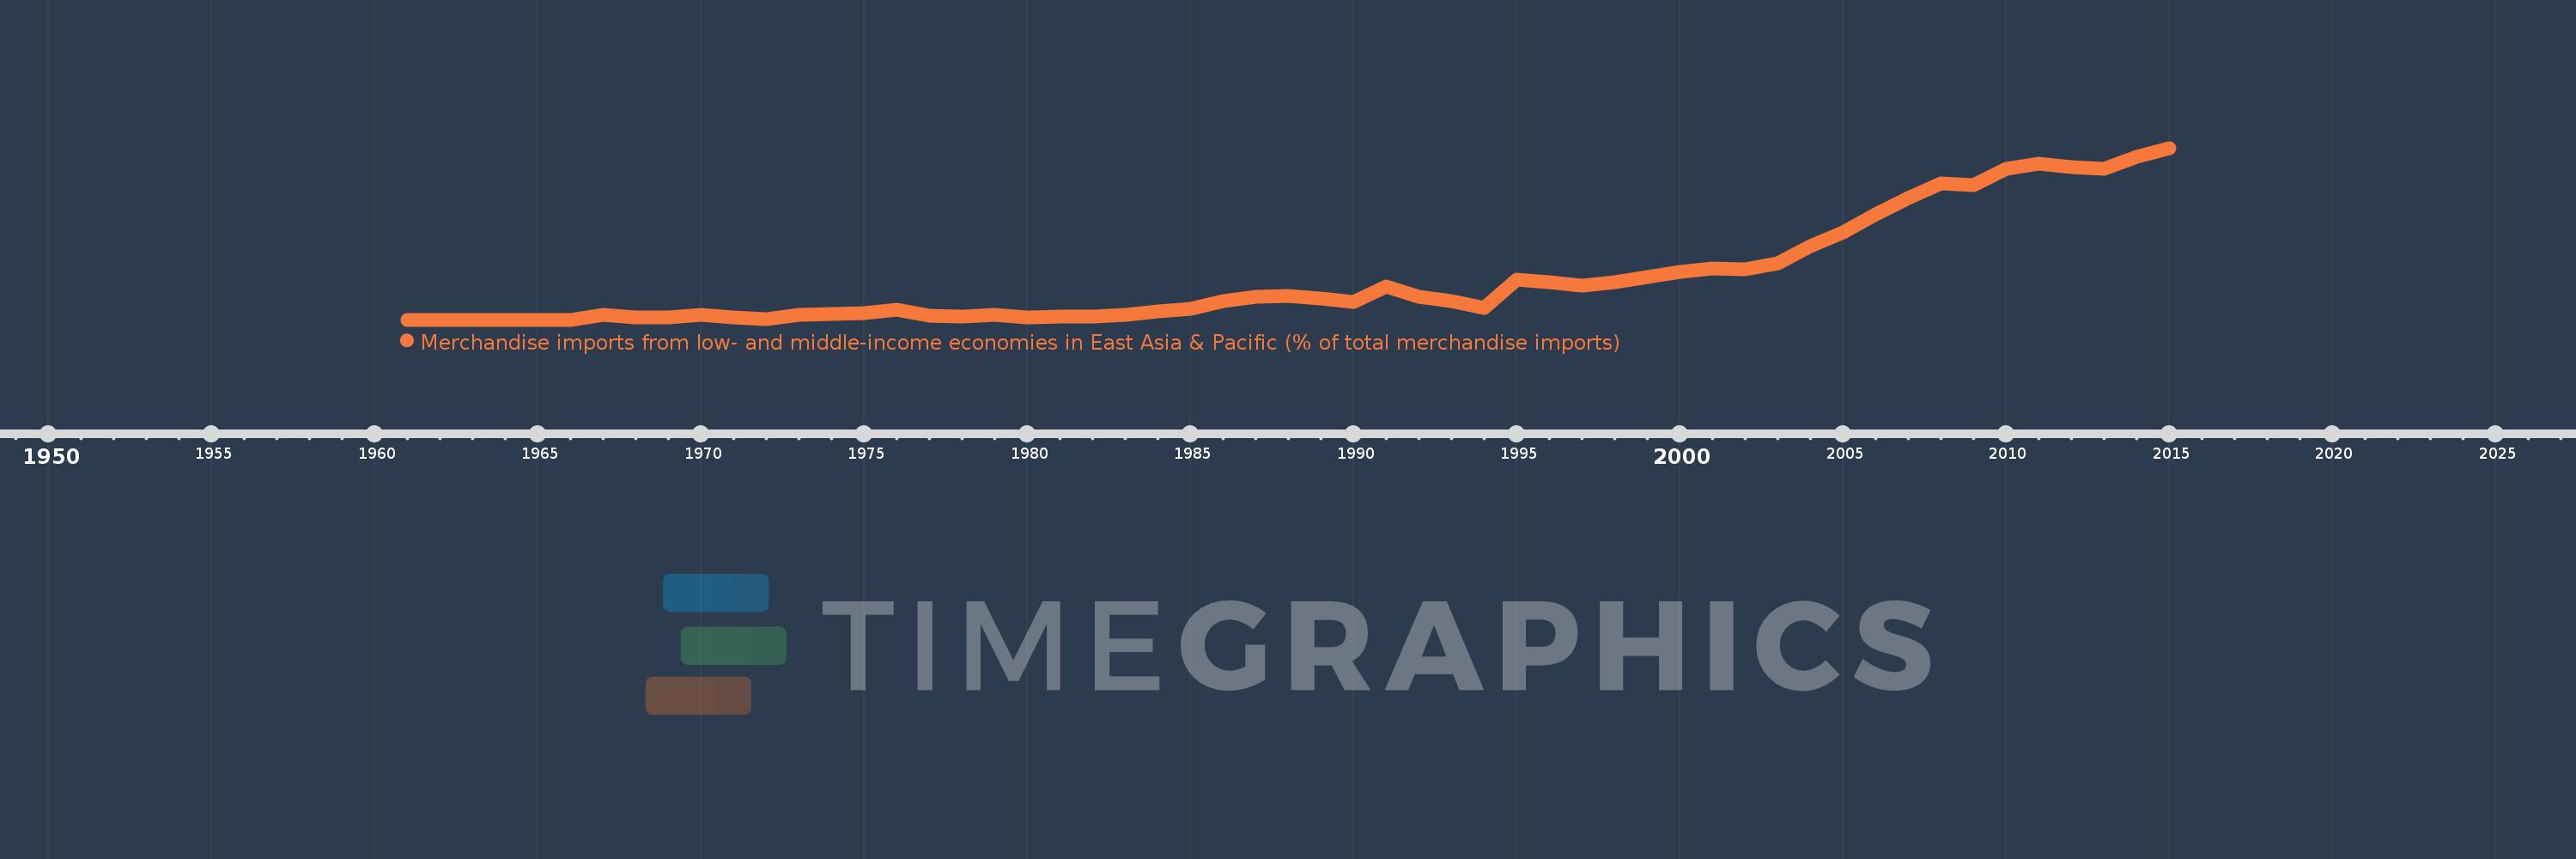
Merchandise imports from low- and middle-income economies in East Asia & Pacific (% of total merchandise imports)
2015,2014,2013,2012,2011,2010,2009,2008,2007,2006,2005,2004,2003,2002,2001,2000,1999,1998,1997,1996,1995,1994,1993,1992,1991,1990,1989,1988,1987,1986,1985,1984,1983,1982,1981,1980,1979,1978,1977,1976,1975,1974,1973,1972,1971,1970,1969,1968,1967,1966,1965,1964,1963,1962,1961
This statistics in other country:
AfghanistanAlbaniaAlgeriaArab WorldArgentinaArmeniaArubaAustraliaAustriaAzerbaijanBahamas, TheBahrainBangladeshBarbadosBelarusBelgiumBelizeBeninBermudaBoliviaBrazilBrunei DarussalamBulgariaBurkina FasoBurundiCabo VerdeCambodiaCameroonCanadaCaribbean small statesCentral African RepublicCentral Europe and the BalticsChileChinaColombiaCongo, Rep.Costa RicaCote d'IvoireCroatiaCyprusCzech RepublicDenmarkDominicaDominican RepublicEarly-demographic dividendEast Asia & PacificEast Asia & Pacific (excluding high income)East Asia & Pacific (IDA & IBRD countries)EcuadorEgypt, Arab Rep.El SalvadorEstoniaEthiopiaEuro areaEurope & Central AsiaEurope & Central Asia (excluding high income)Europe & Central Asia (IDA & IBRD countries)European UnionFijiFinlandFragile and conflict affected situationsFranceFrench PolynesiaGabonGambia, TheGeorgiaGermanyGhanaGreeceGreenlandGrenadaGuatemalaHaitiHeavily indebted poor countries (HIPC)High incomeHondurasHong Kong SAR, ChinaHungaryIBRD onlyIcelandIDA & IBRD totalIDA blendIDA onlyIDA totalIndiaIndonesiaIran, Islamic Rep.IraqIrelandIsraelItalyJamaicaJapanJordanKazakhstanKenyaKorea, Dem. People’s Rep.Korea, Rep.KuwaitKyrgyz RepublicLao PDRLate-demographic dividendLatin America & Caribbean Latin America & Caribbean (excluding high income)Latin America & the Caribbean (IDA & IBRD countries)LatviaLeast developed countries: UN classificationLebanonLithuaniaLow & middle incomeLow incomeLower middle incomeLuxembourgMacao SAR, ChinaMacedonia, FYRMadagascarMalaysiaMaliMaltaMauritiusMexicoMiddle East & North AfricaMiddle East & North Africa (excluding high income)Middle East & North Africa (IDA & IBRD countries)Middle incomeMoldovaMongoliaMontenegroMoroccoMyanmarNetherlandsNew CaledoniaNew ZealandNicaraguaNigerNigeriaNorth AmericaNorwayOECD membersOmanOther small statesPacific island small statesPakistanPanamaPapua New GuineaParaguayPeruPhilippinesPolandPortugalPost-demographic dividendPre-demographic dividendQatarRomaniaRussian FederationSamoaSaudi ArabiaSenegalSerbiaSingaporeSlovak RepublicSloveniaSmall statesSolomon IslandsSomaliaSouth AfricaSouth AsiaSouth Asia (IDA & IBRD)SpainSri LankaSt. Kitts and NevisSt. LuciaSt. Vincent and the GrenadinesSub-Saharan Africa Sub-Saharan Africa (excluding high income)Sub-Saharan Africa (IDA & IBRD countries)SurinameSwedenSwitzerlandTanzaniaThailandTogoTongaTrinidad and TobagoTunisiaTurkeyUgandaUkraineUnited Arab EmiratesUnited KingdomUnited StatesUpper middle incomeUruguayVanuatuVenezuela, RBVietnamWorldYemen, Rep.ZambiaZimbabwe Timeline:
This timeline shows a graph from 1961 to 2015 of Turkey. No data until 1960. Number of actual observations by date: 55.
Source name:
World Development Indicators
Source organization:
World Bank staff estimates based data from International Monetary Fund's Direction of Trade database.
Categories, topics:
Private Sector, Trade
Last updated:
apr 23, 2017
Indicators value changes by year
Maximum:
13.069
jan 1, 2015
At the date of observation
Value
Absolute change
Change from previous value
jan 1, 1967
0.359
+0.359
%
jan 1, 1968
0.174
-0.185
-51.59%
jan 1, 1969
0.169
-0.005
-2.89%
jan 1, 1970
0.405
+0.236
139.72%
jan 1, 1971
0.203
-0.202
-49.92%
jan 1, 1972
0.068
-0.134
-66.36%
jan 1, 1973
0.382
+0.314
461.1%
jan 1, 1974
0.447
+0.065
16.95%
jan 1, 1975
0.484
+0.037
8.25%
jan 1, 1976
0.782
+0.298
61.52%
jan 1, 1977
0.292
-0.489
-62.6%
jan 1, 1978
0.252
-0.04
-13.81%
jan 1, 1979
0.36
+0.108
42.83%
jan 1, 1980
0.202
-0.158
-43.79%
jan 1, 1981
0.255
+0.053
25.96%
jan 1, 1982
0.262
+0.007
2.94%
jan 1, 1983
0.378
+0.116
44.2%
jan 1, 1984
0.621
+0.243
64.19%
jan 1, 1985
0.818
+0.197
31.75%
jan 1, 1986
1.419
+0.6
73.37%
jan 1, 1987
1.721
+0.302
21.28%
jan 1, 1988
1.82
+0.1
5.79%
jan 1, 1989
1.588
-0.232
-12.74%
jan 1, 1990
1.379
-0.21
-13.2%
jan 1, 1991
2.558
+1.179
85.51%
jan 1, 1992
1.772
-0.786
-30.73%
jan 1, 1993
1.45
-0.321
-18.13%
jan 1, 1994
0.865
-0.585
-40.34%
jan 1, 1995
3.069
+2.204
254.73%
jan 1, 1996
2.861
-0.208
-6.79%
jan 1, 1997
2.563
-0.298
-10.43%
jan 1, 1998
2.862
+0.299
11.68%
jan 1, 1999
3.238
+0.376
13.13%
jan 1, 2000
3.633
+0.395
12.21%
jan 1, 2001
3.932
+0.3
8.25%
jan 1, 2002
3.826
-0.107
-2.71%
jan 1, 2003
4.309
+0.484
12.64%
jan 1, 2004
5.573
+1.264
29.33%
jan 1, 2005
6.614
+1.041
18.67%
jan 1, 2006
8.013
+1.399
21.16%
jan 1, 2007
9.246
+1.233
15.39%
jan 1, 2008
10.355
+1.108
11.98%
jan 1, 2009
10.266
-0.089
-0.86%
jan 1, 2010
11.502
+1.236
12.04%
jan 1, 2011
11.846
+0.344
2.99%
jan 1, 2012
11.62
-0.226
-1.91%
jan 1, 2013
11.469
-0.152
-1.3%
jan 1, 2014
12.378
+0.91
7.93%
jan 1, 2015
13.069
+0.691
5.58%
Ranking of countries by current statistics by years


Comments: