29
/
en
AIzaSyAYiBZKx7MnpbEhh9jyipgxe19OcubqV5w
April 1, 2024
157574
Iran, Islamic Rep.
IRN
true
2
1
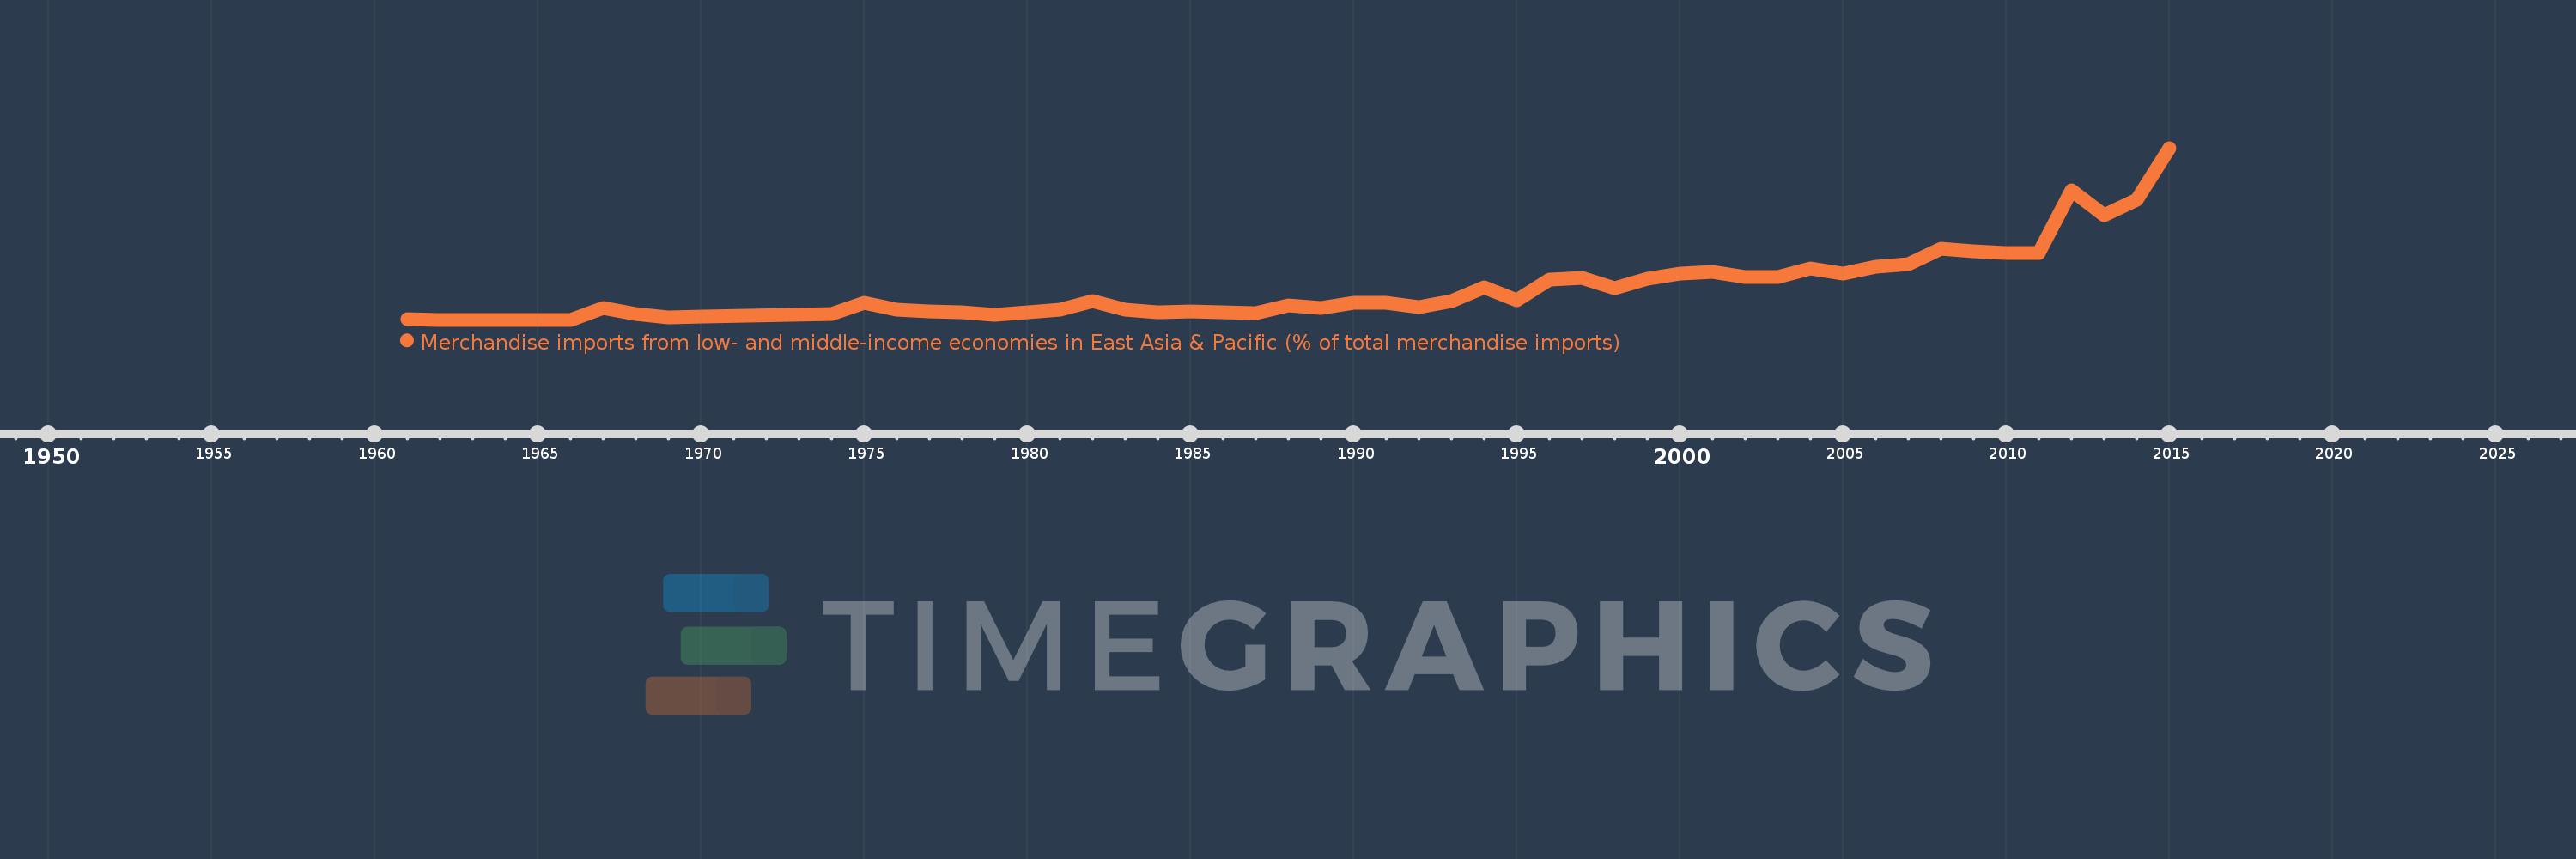
Merchandise imports from low- and middle-income economies in East Asia & Pacific (% of total merchandise imports)
2015,2014,2013,2012,2011,2010,2009,2008,2007,2006,2005,2004,2003,2002,2001,2000,1999,1998,1997,1996,1995,1994,1993,1992,1991,1990,1989,1988,1987,1986,1985,1984,1983,1982,1981,1980,1979,1978,1977,1976,1975,1974,1970,1969,1968,1967,1966,1965,1964,1963,1962,1961
This statistics in other country:
AfghanistanAlbaniaAlgeriaArab WorldArgentinaArmeniaArubaAustraliaAustriaAzerbaijanBahamas, TheBahrainBangladeshBarbadosBelarusBelgiumBelizeBeninBermudaBoliviaBrazilBrunei DarussalamBulgariaBurkina FasoBurundiCabo VerdeCambodiaCameroonCanadaCaribbean small statesCentral African RepublicCentral Europe and the BalticsChileChinaColombiaCongo, Rep.Costa RicaCote d'IvoireCroatiaCyprusCzech RepublicDenmarkDominicaDominican RepublicEarly-demographic dividendEast Asia & PacificEast Asia & Pacific (excluding high income)East Asia & Pacific (IDA & IBRD countries)EcuadorEgypt, Arab Rep.El SalvadorEstoniaEthiopiaEuro areaEurope & Central AsiaEurope & Central Asia (excluding high income)Europe & Central Asia (IDA & IBRD countries)European UnionFijiFinlandFragile and conflict affected situationsFranceFrench PolynesiaGabonGambia, TheGeorgiaGermanyGhanaGreeceGreenlandGrenadaGuatemalaHaitiHeavily indebted poor countries (HIPC)High incomeHondurasHong Kong SAR, ChinaHungaryIBRD onlyIcelandIDA & IBRD totalIDA blendIDA onlyIDA totalIndiaIndonesiaIran, Islamic Rep.IraqIrelandIsraelItalyJamaicaJapanJordanKazakhstanKenyaKorea, Dem. People’s Rep.Korea, Rep.KuwaitKyrgyz RepublicLao PDRLate-demographic dividendLatin America & Caribbean Latin America & Caribbean (excluding high income)Latin America & the Caribbean (IDA & IBRD countries)LatviaLeast developed countries: UN classificationLebanonLithuaniaLow & middle incomeLow incomeLower middle incomeLuxembourgMacao SAR, ChinaMacedonia, FYRMadagascarMalaysiaMaliMaltaMauritiusMexicoMiddle East & North AfricaMiddle East & North Africa (excluding high income)Middle East & North Africa (IDA & IBRD countries)Middle incomeMoldovaMongoliaMontenegroMoroccoMyanmarNetherlandsNew CaledoniaNew ZealandNicaraguaNigerNigeriaNorth AmericaNorwayOECD membersOmanOther small statesPacific island small statesPakistanPanamaPapua New GuineaParaguayPeruPhilippinesPolandPortugalPost-demographic dividendPre-demographic dividendQatarRomaniaRussian FederationSamoaSaudi ArabiaSenegalSerbiaSingaporeSlovak RepublicSloveniaSmall statesSolomon IslandsSomaliaSouth AfricaSouth AsiaSouth Asia (IDA & IBRD)SpainSri LankaSt. Kitts and NevisSt. LuciaSt. Vincent and the GrenadinesSub-Saharan Africa Sub-Saharan Africa (excluding high income)Sub-Saharan Africa (IDA & IBRD countries)SurinameSwedenSwitzerlandTanzaniaThailandTogoTongaTrinidad and TobagoTunisiaTurkeyUgandaUkraineUnited Arab EmiratesUnited KingdomUnited StatesUpper middle incomeUruguayVanuatuVenezuela, RBVietnamWorldYemen, Rep.ZambiaZimbabwe Timeline:
This timeline shows a graph from 1961 to 2015 of Iran, Islamic Rep.. No data until 1960. Number of actual observations by date: 52.
Source name:
World Development Indicators
Source organization:
World Bank staff estimates based data from International Monetary Fund's Direction of Trade database.
Categories, topics:
Private Sector, Trade
Last updated:
apr 23, 2017
Indicators value changes by year
Maximum:
26.988
jan 1, 2015
At the date of observation
Value
Absolute change
Change from previous value
jan 1, 1961
0.036
+0.036
0.0%
jan 1, 1962
0.017
-0.019
-53.71%
jan 1, 1963
0.0
-0.017
-100.0%
jan 1, 1966
0.012
+0.012
%
jan 1, 1967
1.832
+1.82
15.57K%
jan 1, 1968
0.97
-0.862
-47.05%
jan 1, 1969
0.373
-0.597
-61.51%
jan 1, 1970
0.498
+0.125
33.52%
jan 1, 1974
0.947
+0.449
90.01%
jan 1, 1975
2.597
+1.65
174.21%
jan 1, 1976
1.639
-0.958
-36.87%
jan 1, 1977
1.37
-0.27
-16.45%
jan 1, 1978
1.112
-0.258
-18.82%
jan 1, 1979
0.733
-0.379
-34.1%
jan 1, 1980
1.124
+0.392
53.44%
jan 1, 1981
1.512
+0.387
34.45%
jan 1, 1982
2.886
+1.374
90.89%
jan 1, 1983
1.562
-1.324
-45.88%
jan 1, 1984
1.188
-0.374
-23.96%
jan 1, 1985
1.318
+0.13
10.96%
jan 1, 1986
1.14
-0.178
-13.53%
jan 1, 1987
1.101
-0.039
-3.38%
jan 1, 1988
2.305
+1.204
109.4%
jan 1, 1989
1.836
-0.47
-20.37%
jan 1, 1990
2.631
+0.796
43.34%
jan 1, 1991
2.67
+0.038
1.45%
jan 1, 1992
1.947
-0.723
-27.07%
jan 1, 1993
2.908
+0.961
49.36%
jan 1, 1994
5.115
+2.207
75.9%
jan 1, 1995
3.006
-2.11
-41.24%
jan 1, 1996
6.261
+3.255
108.31%
jan 1, 1997
6.52
+0.259
4.14%
jan 1, 1998
5.001
-1.518
-23.29%
jan 1, 1999
6.374
+1.373
27.45%
jan 1, 2000
7.309
+0.935
14.66%
jan 1, 2001
7.478
+0.169
2.31%
jan 1, 2002
6.722
-0.756
-10.11%
jan 1, 2003
6.696
-0.026
-0.39%
jan 1, 2004
8.011
+1.315
19.64%
jan 1, 2005
7.234
-0.777
-9.7%
jan 1, 2006
8.261
+1.028
14.21%
jan 1, 2007
8.697
+0.436
5.28%
jan 1, 2008
11.114
+2.417
27.78%
jan 1, 2009
10.708
-0.406
-3.66%
jan 1, 2010
10.467
-0.24
-2.24%
jan 1, 2011
10.445
-0.022
-0.21%
jan 1, 2012
20.328
+9.882
94.61%
jan 1, 2013
16.468
-3.86
-18.99%
jan 1, 2014
18.855
+2.387
14.49%
jan 1, 2015
26.988
+8.133
43.13%
Ranking of countries by current statistics by years


Comments: