29
/
en
AIzaSyAYiBZKx7MnpbEhh9jyipgxe19OcubqV5w
April 1, 2024
219844
Papua New Guinea
PNG
true
2
1
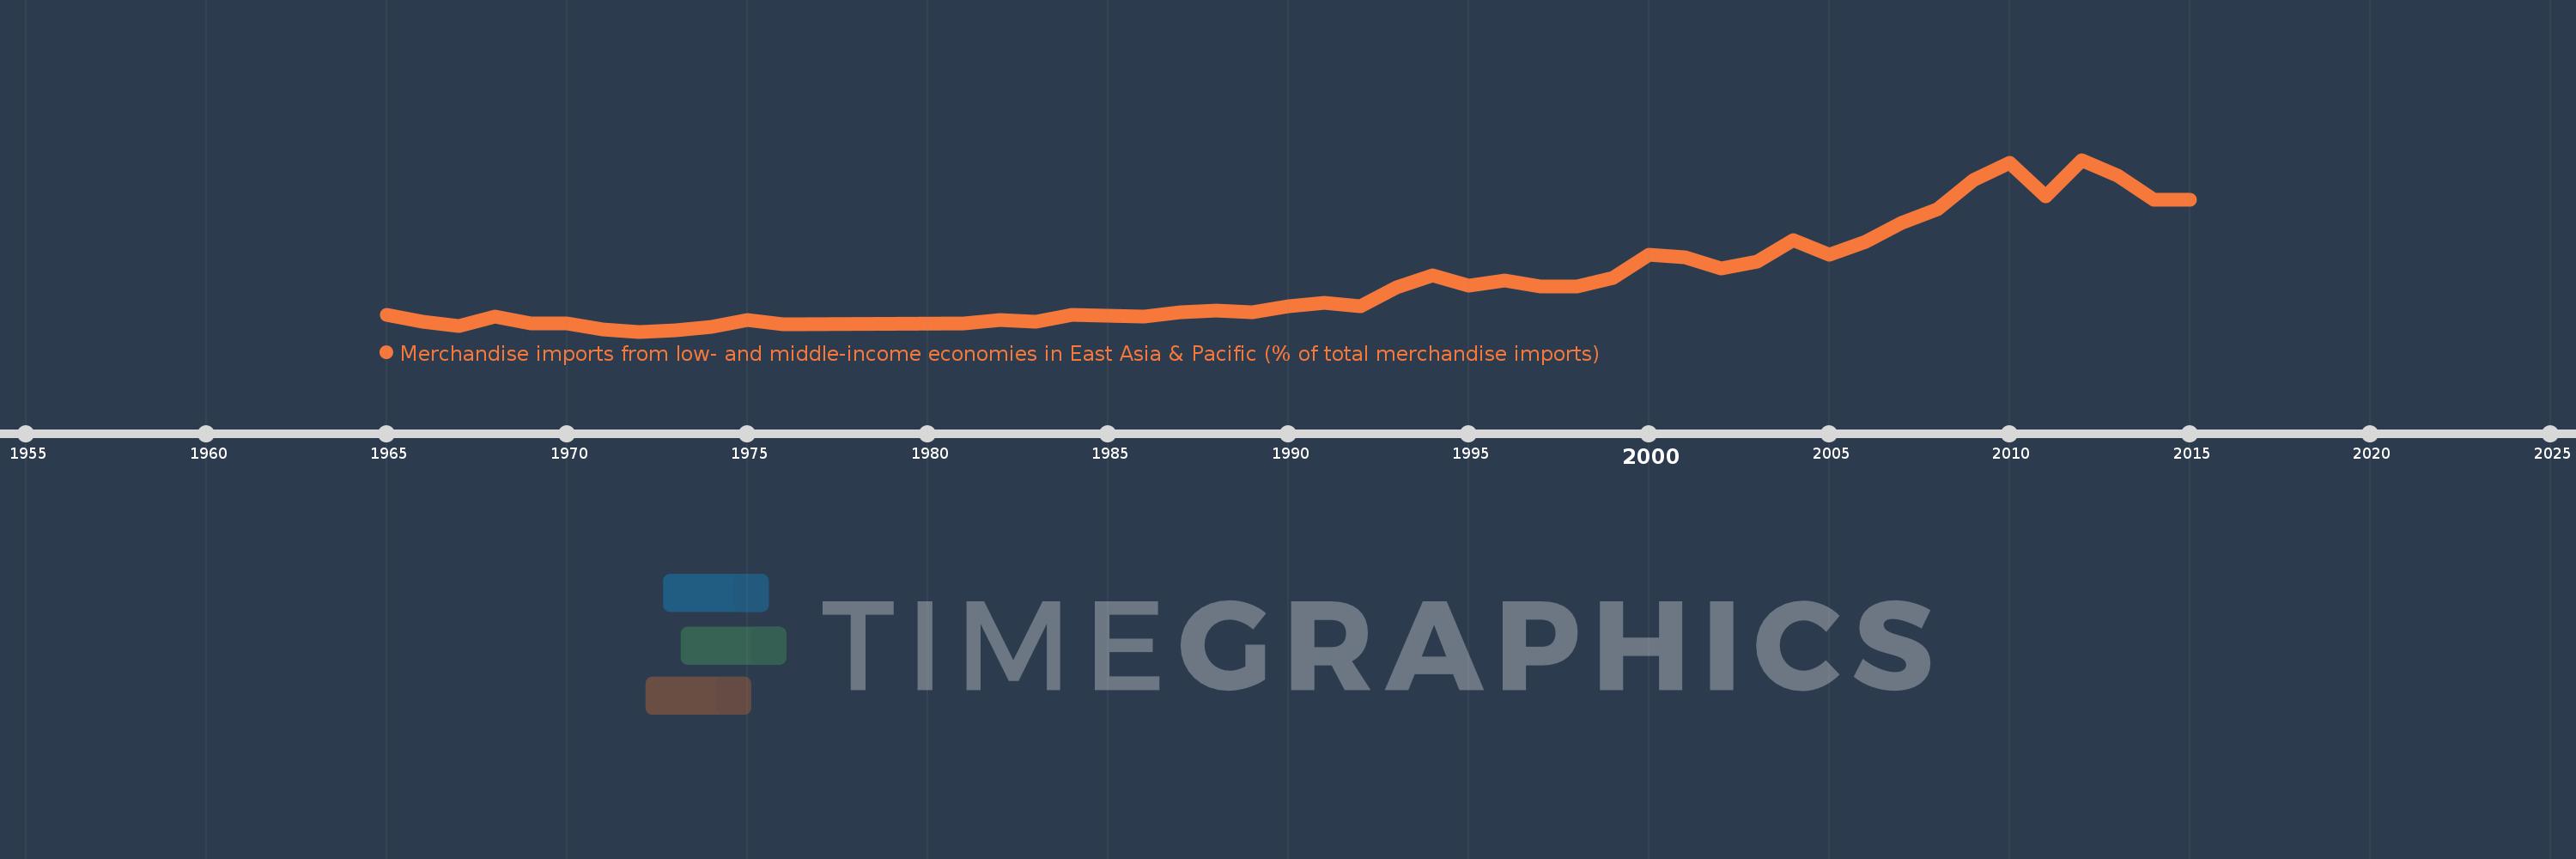
Merchandise imports from low- and middle-income economies in East Asia & Pacific (% of total merchandise imports)
2015,2014,2013,2012,2011,2010,2009,2008,2007,2006,2005,2004,2003,2002,2001,2000,1999,1998,1997,1996,1995,1994,1993,1992,1991,1990,1989,1988,1987,1986,1985,1984,1983,1982,1981,1976,1975,1974,1973,1972,1971,1970,1969,1968,1967,1966,1965
This statistics in other country:
AfghanistanAlbaniaAlgeriaArab WorldArgentinaArmeniaArubaAustraliaAustriaAzerbaijanBahamas, TheBahrainBangladeshBarbadosBelarusBelgiumBelizeBeninBermudaBoliviaBrazilBrunei DarussalamBulgariaBurkina FasoBurundiCabo VerdeCambodiaCameroonCanadaCaribbean small statesCentral African RepublicCentral Europe and the BalticsChileChinaColombiaCongo, Rep.Costa RicaCote d'IvoireCroatiaCyprusCzech RepublicDenmarkDominicaDominican RepublicEarly-demographic dividendEast Asia & PacificEast Asia & Pacific (excluding high income)East Asia & Pacific (IDA & IBRD countries)EcuadorEgypt, Arab Rep.El SalvadorEstoniaEthiopiaEuro areaEurope & Central AsiaEurope & Central Asia (excluding high income)Europe & Central Asia (IDA & IBRD countries)European UnionFijiFinlandFragile and conflict affected situationsFranceFrench PolynesiaGabonGambia, TheGeorgiaGermanyGhanaGreeceGreenlandGrenadaGuatemalaHaitiHeavily indebted poor countries (HIPC)High incomeHondurasHong Kong SAR, ChinaHungaryIBRD onlyIcelandIDA & IBRD totalIDA blendIDA onlyIDA totalIndiaIndonesiaIran, Islamic Rep.IraqIrelandIsraelItalyJamaicaJapanJordanKazakhstanKenyaKorea, Dem. People’s Rep.Korea, Rep.KuwaitKyrgyz RepublicLao PDRLate-demographic dividendLatin America & Caribbean Latin America & Caribbean (excluding high income)Latin America & the Caribbean (IDA & IBRD countries)LatviaLeast developed countries: UN classificationLebanonLithuaniaLow & middle incomeLow incomeLower middle incomeLuxembourgMacao SAR, ChinaMacedonia, FYRMadagascarMalaysiaMaliMaltaMauritiusMexicoMiddle East & North AfricaMiddle East & North Africa (excluding high income)Middle East & North Africa (IDA & IBRD countries)Middle incomeMoldovaMongoliaMontenegroMoroccoMyanmarNetherlandsNew CaledoniaNew ZealandNicaraguaNigerNigeriaNorth AmericaNorwayOECD membersOmanOther small statesPacific island small statesPakistanPanamaPapua New GuineaParaguayPeruPhilippinesPolandPortugalPost-demographic dividendPre-demographic dividendQatarRomaniaRussian FederationSamoaSaudi ArabiaSenegalSerbiaSingaporeSlovak RepublicSloveniaSmall statesSolomon IslandsSomaliaSouth AfricaSouth AsiaSouth Asia (IDA & IBRD)SpainSri LankaSt. Kitts and NevisSt. LuciaSt. Vincent and the GrenadinesSub-Saharan Africa Sub-Saharan Africa (excluding high income)Sub-Saharan Africa (IDA & IBRD countries)SurinameSwedenSwitzerlandTanzaniaThailandTogoTongaTrinidad and TobagoTunisiaTurkeyUgandaUkraineUnited Arab EmiratesUnited KingdomUnited StatesUpper middle incomeUruguayVanuatuVenezuela, RBVietnamWorldYemen, Rep.ZambiaZimbabwe Timeline:
This timeline shows a graph from 1965 to 2015 of Papua New Guinea. No data until 1964. Number of actual observations by date: 47.
Source name:
World Development Indicators
Source organization:
World Bank staff estimates based data from International Monetary Fund's Direction of Trade database.
Categories, topics:
Private Sector, Trade
Last updated:
apr 23, 2017
Indicators value changes by year
Maximum:
24.712
jan 1, 2012
At the date of observation
Value
Absolute change
Change from previous value
jan 1, 1965
3.189
+3.189
0.0%
jan 1, 1966
2.224
-0.964
-30.24%
jan 1, 1967
1.652
-0.572
-25.72%
jan 1, 1968
2.996
+1.343
81.3%
jan 1, 1969
2.066
-0.93
-31.03%
jan 1, 1970
1.975
-0.091
-4.41%
jan 1, 1971
1.139
-0.836
-42.31%
jan 1, 1972
0.895
-0.245
-21.46%
jan 1, 1973
1.129
+0.235
26.23%
jan 1, 1974
1.555
+0.425
37.66%
jan 1, 1975
2.512
+0.957
61.55%
jan 1, 1976
1.924
-0.588
-23.4%
jan 1, 1981
2.042
+0.118
6.11%
jan 1, 1982
2.529
+0.488
23.89%
jan 1, 1983
2.234
-0.296
-11.69%
jan 1, 1984
3.162
+0.929
41.59%
jan 1, 1985
3.085
-0.078
-2.46%
jan 1, 1986
2.934
-0.151
-4.89%
jan 1, 1987
3.546
+0.612
20.88%
jan 1, 1988
3.792
+0.246
6.94%
jan 1, 1989
3.633
-0.16
-4.21%
jan 1, 1990
4.382
+0.749
20.62%
jan 1, 1991
4.859
+0.477
10.9%
jan 1, 1992
4.408
-0.451
-9.28%
jan 1, 1993
7.07
+2.661
60.37%
jan 1, 1994
8.723
+1.654
23.39%
jan 1, 1995
7.239
-1.484
-17.01%
jan 1, 1996
7.991
+0.752
10.39%
jan 1, 1997
7.18
-0.811
-10.15%
jan 1, 1998
7.157
-0.024
-0.33%
jan 1, 1999
8.309
+1.152
16.1%
jan 1, 2000
11.598
+3.29
39.59%
jan 1, 2001
11.213
-0.385
-3.32%
jan 1, 2002
9.693
-1.52
-13.55%
jan 1, 2003
10.547
+0.854
8.81%
jan 1, 2004
13.525
+2.978
28.23%
jan 1, 2005
11.602
-1.923
-14.22%
jan 1, 2006
13.293
+1.691
14.57%
jan 1, 2007
15.905
+2.612
19.65%
jan 1, 2008
17.822
+1.918
12.06%
jan 1, 2009
21.907
+4.085
22.92%
jan 1, 2010
24.317
+2.41
11.0%
jan 1, 2011
19.63
-4.688
-19.28%
jan 1, 2012
24.712
+5.082
25.89%
jan 1, 2013
22.486
-2.226
-9.01%
jan 1, 2014
19.159
-3.327
-14.8%
jan 1, 2015
19.137
-0.022
-0.11%
Ranking of countries by current statistics by years


Comments: