29
/
en
AIzaSyAYiBZKx7MnpbEhh9jyipgxe19OcubqV5w
April 1, 2024
276902
United States
USA
true
2
1
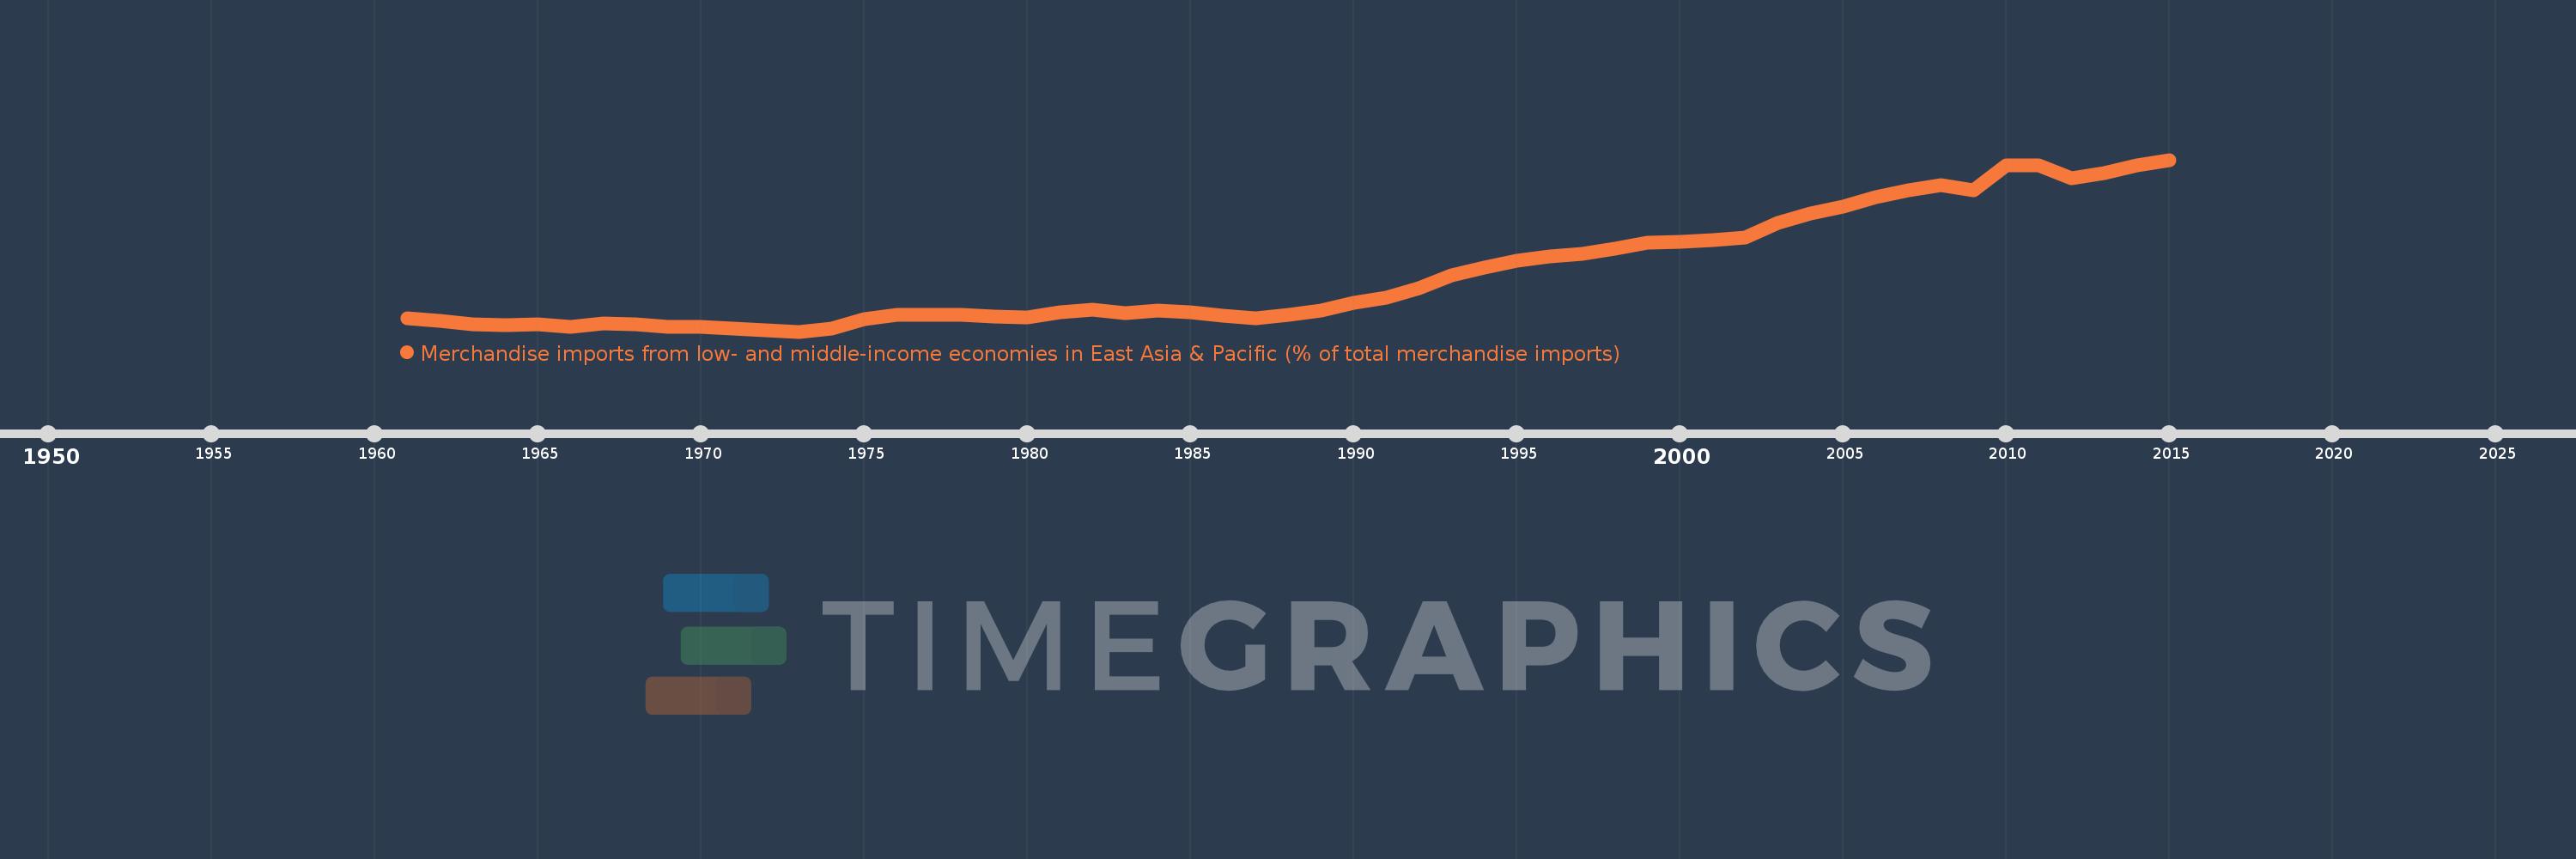
Merchandise imports from low- and middle-income economies in East Asia & Pacific (% of total merchandise imports)
2015,2014,2013,2012,2011,2010,2009,2008,2007,2006,2005,2004,2003,2002,2001,2000,1999,1998,1997,1996,1995,1994,1993,1992,1991,1990,1989,1988,1987,1986,1985,1984,1983,1982,1981,1980,1979,1978,1977,1976,1975,1974,1973,1972,1971,1970,1969,1968,1967,1966,1965,1964,1963,1962,1961
This statistics in other country:
AfghanistanAlbaniaAlgeriaArab WorldArgentinaArmeniaArubaAustraliaAustriaAzerbaijanBahamas, TheBahrainBangladeshBarbadosBelarusBelgiumBelizeBeninBermudaBoliviaBrazilBrunei DarussalamBulgariaBurkina FasoBurundiCabo VerdeCambodiaCameroonCanadaCaribbean small statesCentral African RepublicCentral Europe and the BalticsChileChinaColombiaCongo, Rep.Costa RicaCote d'IvoireCroatiaCyprusCzech RepublicDenmarkDominicaDominican RepublicEarly-demographic dividendEast Asia & PacificEast Asia & Pacific (excluding high income)East Asia & Pacific (IDA & IBRD countries)EcuadorEgypt, Arab Rep.El SalvadorEstoniaEthiopiaEuro areaEurope & Central AsiaEurope & Central Asia (excluding high income)Europe & Central Asia (IDA & IBRD countries)European UnionFijiFinlandFragile and conflict affected situationsFranceFrench PolynesiaGabonGambia, TheGeorgiaGermanyGhanaGreeceGreenlandGrenadaGuatemalaHaitiHeavily indebted poor countries (HIPC)High incomeHondurasHong Kong SAR, ChinaHungaryIBRD onlyIcelandIDA & IBRD totalIDA blendIDA onlyIDA totalIndiaIndonesiaIran, Islamic Rep.IraqIrelandIsraelItalyJamaicaJapanJordanKazakhstanKenyaKorea, Dem. People’s Rep.Korea, Rep.KuwaitKyrgyz RepublicLao PDRLate-demographic dividendLatin America & Caribbean Latin America & Caribbean (excluding high income)Latin America & the Caribbean (IDA & IBRD countries)LatviaLeast developed countries: UN classificationLebanonLithuaniaLow & middle incomeLow incomeLower middle incomeLuxembourgMacao SAR, ChinaMacedonia, FYRMadagascarMalaysiaMaliMaltaMauritiusMexicoMiddle East & North AfricaMiddle East & North Africa (excluding high income)Middle East & North Africa (IDA & IBRD countries)Middle incomeMoldovaMongoliaMontenegroMoroccoMyanmarNetherlandsNew CaledoniaNew ZealandNicaraguaNigerNigeriaNorth AmericaNorwayOECD membersOmanOther small statesPacific island small statesPakistanPanamaPapua New GuineaParaguayPeruPhilippinesPolandPortugalPost-demographic dividendPre-demographic dividendQatarRomaniaRussian FederationSamoaSaudi ArabiaSenegalSerbiaSingaporeSlovak RepublicSloveniaSmall statesSolomon IslandsSomaliaSouth AfricaSouth AsiaSouth Asia (IDA & IBRD)SpainSri LankaSt. Kitts and NevisSt. LuciaSt. Vincent and the GrenadinesSub-Saharan Africa Sub-Saharan Africa (excluding high income)Sub-Saharan Africa (IDA & IBRD countries)SurinameSwedenSwitzerlandTanzaniaThailandTogoTongaTrinidad and TobagoTunisiaTurkeyUgandaUkraineUnited Arab EmiratesUnited KingdomUnited StatesUpper middle incomeUruguayVanuatuVenezuela, RBVietnamWorldYemen, Rep.ZambiaZimbabwe Timeline:
This timeline shows a graph from 1961 to 2015 of United States. No data until 1960. Number of actual observations by date: 55.
Source name:
World Development Indicators
Source organization:
World Bank staff estimates based data from International Monetary Fund's Direction of Trade database.
Categories, topics:
Private Sector, Trade
Last updated:
apr 23, 2017
Indicators value changes by year
Maximum:
25.033
jan 1, 2015
At the date of observation
Value
Absolute change
Change from previous value
jan 1, 1961
3.976
+3.976
0.0%
jan 1, 1962
3.622
-0.355
-8.92%
jan 1, 1963
3.139
-0.483
-13.33%
jan 1, 1964
3.08
-0.059
-1.87%
jan 1, 1965
3.222
+0.142
4.61%
jan 1, 1966
2.784
-0.438
-13.59%
jan 1, 1967
3.295
+0.511
18.37%
jan 1, 1968
3.227
-0.068
-2.07%
jan 1, 1969
2.847
-0.38
-11.78%
jan 1, 1970
2.867
+0.019
0.68%
jan 1, 1971
2.598
-0.269
-9.37%
jan 1, 1972
2.384
-0.214
-8.23%
jan 1, 1973
2.212
-0.172
-7.23%
jan 1, 1974
2.646
+0.434
19.63%
jan 1, 1975
3.817
+1.171
44.25%
jan 1, 1976
4.395
+0.578
15.15%
jan 1, 1977
4.457
+0.062
1.4%
jan 1, 1978
4.4
-0.057
-1.28%
jan 1, 1979
4.174
-0.226
-5.13%
jan 1, 1980
4.148
-0.026
-0.61%
jan 1, 1981
4.761
+0.613
14.77%
jan 1, 1982
5.118
+0.357
7.49%
jan 1, 1983
4.678
-0.44
-8.59%
jan 1, 1984
5.032
+0.354
7.57%
jan 1, 1985
4.741
-0.292
-5.8%
jan 1, 1986
4.289
-0.451
-9.52%
jan 1, 1987
4.014
-0.275
-6.42%
jan 1, 1988
4.384
+0.37
9.21%
jan 1, 1989
5.001
+0.617
14.08%
jan 1, 1990
6.028
+1.028
20.55%
jan 1, 1991
6.725
+0.697
11.56%
jan 1, 1992
7.952
+1.227
18.24%
jan 1, 1993
9.669
+1.717
21.59%
jan 1, 1994
10.742
+1.073
11.1%
jan 1, 1995
11.609
+0.867
8.07%
jan 1, 1996
12.212
+0.604
5.2%
jan 1, 1997
12.53
+0.318
2.6%
jan 1, 1998
13.224
+0.694
5.54%
jan 1, 1999
14.017
+0.793
6.0%
jan 1, 2000
14.118
+0.101
0.72%
jan 1, 2001
14.314
+0.196
1.39%
jan 1, 2002
14.726
+0.412
2.88%
jan 1, 2003
16.658
+1.932
13.12%
jan 1, 2004
17.876
+1.218
7.31%
jan 1, 2005
18.838
+0.962
5.38%
jan 1, 2006
20.069
+1.231
6.54%
jan 1, 2007
21.023
+0.954
4.75%
jan 1, 2008
21.666
+0.643
3.06%
jan 1, 2009
21.013
-0.653
-3.02%
jan 1, 2010
24.285
+3.272
15.57%
jan 1, 2011
24.267
-0.017
-0.07%
jan 1, 2012
22.591
-1.677
-6.91%
jan 1, 2013
23.22
+0.629
2.79%
jan 1, 2014
24.24
+1.021
4.4%
jan 1, 2015
25.033
+0.792
3.27%
Ranking of countries by current statistics by years


Comments: