29
/
en
AIzaSyAYiBZKx7MnpbEhh9jyipgxe19OcubqV5w
April 1, 2024
159673
Ireland
IRL
true
2
1
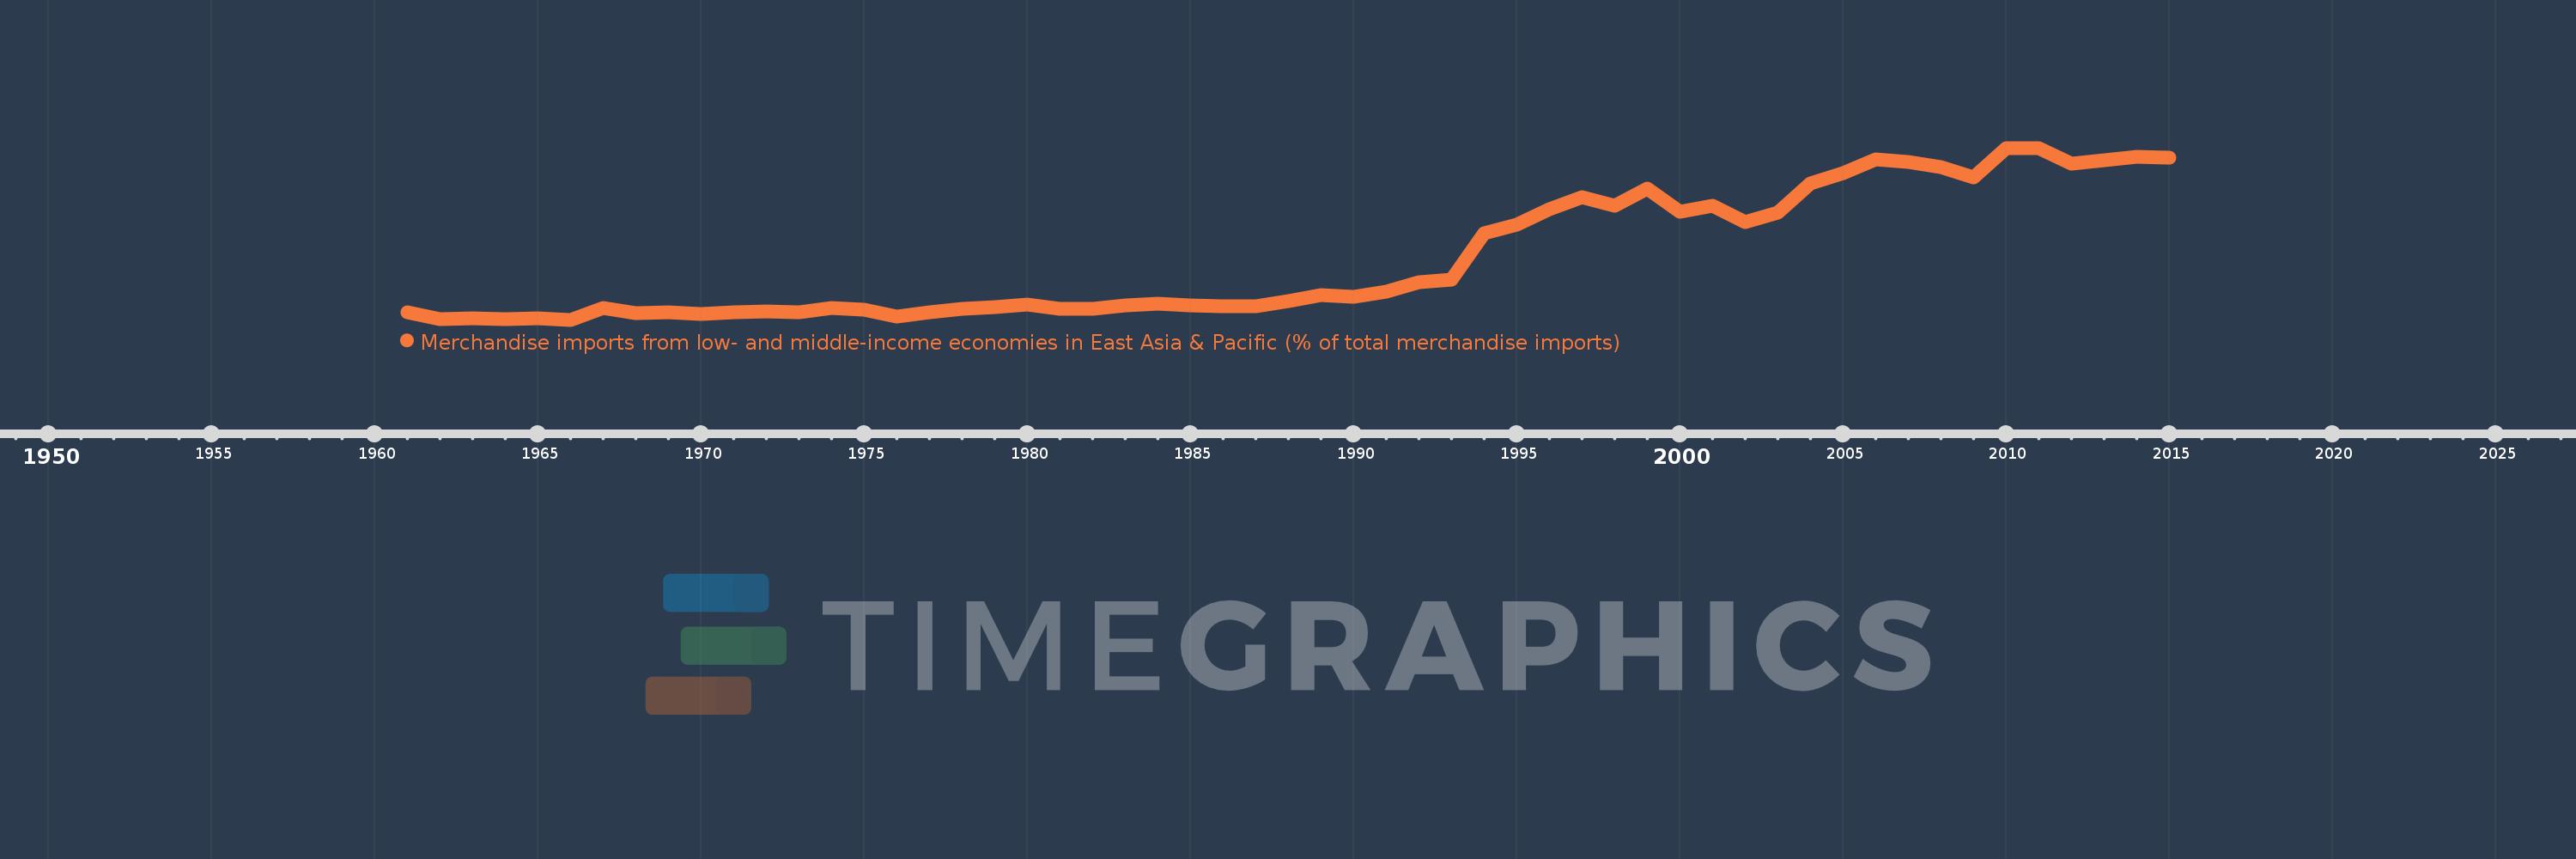
Merchandise imports from low- and middle-income economies in East Asia & Pacific (% of total merchandise imports)
2015,2014,2013,2012,2011,2010,2009,2008,2007,2006,2005,2004,2003,2002,2001,2000,1999,1998,1997,1996,1995,1994,1993,1992,1991,1990,1989,1988,1987,1986,1985,1984,1983,1982,1981,1980,1979,1978,1977,1976,1975,1974,1973,1972,1971,1970,1969,1968,1967,1966,1965,1964,1963,1962,1961
This statistics in other country:
AfghanistanAlbaniaAlgeriaArab WorldArgentinaArmeniaArubaAustraliaAustriaAzerbaijanBahamas, TheBahrainBangladeshBarbadosBelarusBelgiumBelizeBeninBermudaBoliviaBrazilBrunei DarussalamBulgariaBurkina FasoBurundiCabo VerdeCambodiaCameroonCanadaCaribbean small statesCentral African RepublicCentral Europe and the BalticsChileChinaColombiaCongo, Rep.Costa RicaCote d'IvoireCroatiaCyprusCzech RepublicDenmarkDominicaDominican RepublicEarly-demographic dividendEast Asia & PacificEast Asia & Pacific (excluding high income)East Asia & Pacific (IDA & IBRD countries)EcuadorEgypt, Arab Rep.El SalvadorEstoniaEthiopiaEuro areaEurope & Central AsiaEurope & Central Asia (excluding high income)Europe & Central Asia (IDA & IBRD countries)European UnionFijiFinlandFragile and conflict affected situationsFranceFrench PolynesiaGabonGambia, TheGeorgiaGermanyGhanaGreeceGreenlandGrenadaGuatemalaHaitiHeavily indebted poor countries (HIPC)High incomeHondurasHong Kong SAR, ChinaHungaryIBRD onlyIcelandIDA & IBRD totalIDA blendIDA onlyIDA totalIndiaIndonesiaIran, Islamic Rep.IraqIrelandIsraelItalyJamaicaJapanJordanKazakhstanKenyaKorea, Dem. People’s Rep.Korea, Rep.KuwaitKyrgyz RepublicLao PDRLate-demographic dividendLatin America & Caribbean Latin America & Caribbean (excluding high income)Latin America & the Caribbean (IDA & IBRD countries)LatviaLeast developed countries: UN classificationLebanonLithuaniaLow & middle incomeLow incomeLower middle incomeLuxembourgMacao SAR, ChinaMacedonia, FYRMadagascarMalaysiaMaliMaltaMauritiusMexicoMiddle East & North AfricaMiddle East & North Africa (excluding high income)Middle East & North Africa (IDA & IBRD countries)Middle incomeMoldovaMongoliaMontenegroMoroccoMyanmarNetherlandsNew CaledoniaNew ZealandNicaraguaNigerNigeriaNorth AmericaNorwayOECD membersOmanOther small statesPacific island small statesPakistanPanamaPapua New GuineaParaguayPeruPhilippinesPolandPortugalPost-demographic dividendPre-demographic dividendQatarRomaniaRussian FederationSamoaSaudi ArabiaSenegalSerbiaSingaporeSlovak RepublicSloveniaSmall statesSolomon IslandsSomaliaSouth AfricaSouth AsiaSouth Asia (IDA & IBRD)SpainSri LankaSt. Kitts and NevisSt. LuciaSt. Vincent and the GrenadinesSub-Saharan Africa Sub-Saharan Africa (excluding high income)Sub-Saharan Africa (IDA & IBRD countries)SurinameSwedenSwitzerlandTanzaniaThailandTogoTongaTrinidad and TobagoTunisiaTurkeyUgandaUkraineUnited Arab EmiratesUnited KingdomUnited StatesUpper middle incomeUruguayVanuatuVenezuela, RBVietnamWorldYemen, Rep.ZambiaZimbabwe Timeline:
This timeline shows a graph from 1961 to 2015 of Ireland. No data until 1960. Number of actual observations by date: 55.
Source name:
World Development Indicators
Source organization:
World Bank staff estimates based data from International Monetary Fund's Direction of Trade database.
Categories, topics:
Private Sector, Trade
Last updated:
apr 23, 2017
Indicators value changes by year
At the date of observation
Value
Absolute change
Change from previous value
jan 1, 1961
0.508
+0.508
0.0%
jan 1, 1962
0.316
-0.192
-37.88%
jan 1, 1963
0.327
+0.012
3.76%
jan 1, 1964
0.305
-0.022
-6.84%
jan 1, 1965
0.341
+0.036
11.79%
jan 1, 1966
0.289
-0.052
-15.14%
jan 1, 1967
0.634
+0.344
118.97%
jan 1, 1968
0.473
-0.161
-25.41%
jan 1, 1969
0.494
+0.022
4.56%
jan 1, 1970
0.451
-0.043
-8.7%
jan 1, 1971
0.496
+0.045
9.88%
jan 1, 1972
0.536
+0.04
8.12%
jan 1, 1973
0.493
-0.043
-8.06%
jan 1, 1974
0.625
+0.132
26.82%
jan 1, 1975
0.575
-0.05
-7.95%
jan 1, 1976
0.393
-0.182
-31.66%
jan 1, 1977
0.51
+0.117
29.74%
jan 1, 1978
0.603
+0.092
18.12%
jan 1, 1979
0.666
+0.063
10.53%
jan 1, 1980
0.736
+0.07
10.5%
jan 1, 1981
0.597
-0.139
-18.88%
jan 1, 1982
0.607
+0.01
1.7%
jan 1, 1983
0.71
+0.103
16.95%
jan 1, 1984
0.751
+0.041
5.75%
jan 1, 1985
0.71
-0.041
-5.41%
jan 1, 1986
0.687
-0.023
-3.31%
jan 1, 1987
0.69
+0.003
0.4%
jan 1, 1988
0.821
+0.131
19.02%
jan 1, 1989
1.006
+0.185
22.59%
jan 1, 1990
0.942
-0.064
-6.4%
jan 1, 1991
1.096
+0.154
16.37%
jan 1, 1992
1.368
+0.273
24.87%
jan 1, 1993
1.461
+0.093
6.78%
jan 1, 1994
2.803
+1.342
91.84%
jan 1, 1995
3.036
+0.233
8.31%
jan 1, 1996
3.476
+0.44
14.49%
jan 1, 1997
3.845
+0.368
10.6%
jan 1, 1998
3.589
-0.256
-6.65%
jan 1, 1999
4.09
+0.501
13.95%
jan 1, 2000
3.407
-0.682
-16.69%
jan 1, 2001
3.592
+0.185
5.42%
jan 1, 2002
3.107
-0.485
-13.5%
jan 1, 2003
3.389
+0.282
9.06%
jan 1, 2004
4.234
+0.845
24.93%
jan 1, 2005
4.53
+0.297
7.0%
jan 1, 2006
4.924
+0.393
8.68%
jan 1, 2007
4.861
-0.062
-1.26%
jan 1, 2008
4.712
-0.149
-3.07%
jan 1, 2009
4.406
-0.306
-6.5%
jan 1, 2010
5.258
+0.852
19.33%
jan 1, 2011
5.256
-0.002
-0.03%
jan 1, 2012
4.791
-0.465
-8.85%
jan 1, 2013
4.908
+0.117
2.45%
jan 1, 2014
4.992
+0.084
1.72%
jan 1, 2015
4.981
-0.011
-0.22%
Ranking of countries by current statistics by years


Comments: