29
/
en
AIzaSyAYiBZKx7MnpbEhh9jyipgxe19OcubqV5w
April 1, 2024
113871
Cote d'Ivoire
CIV
true
2
1
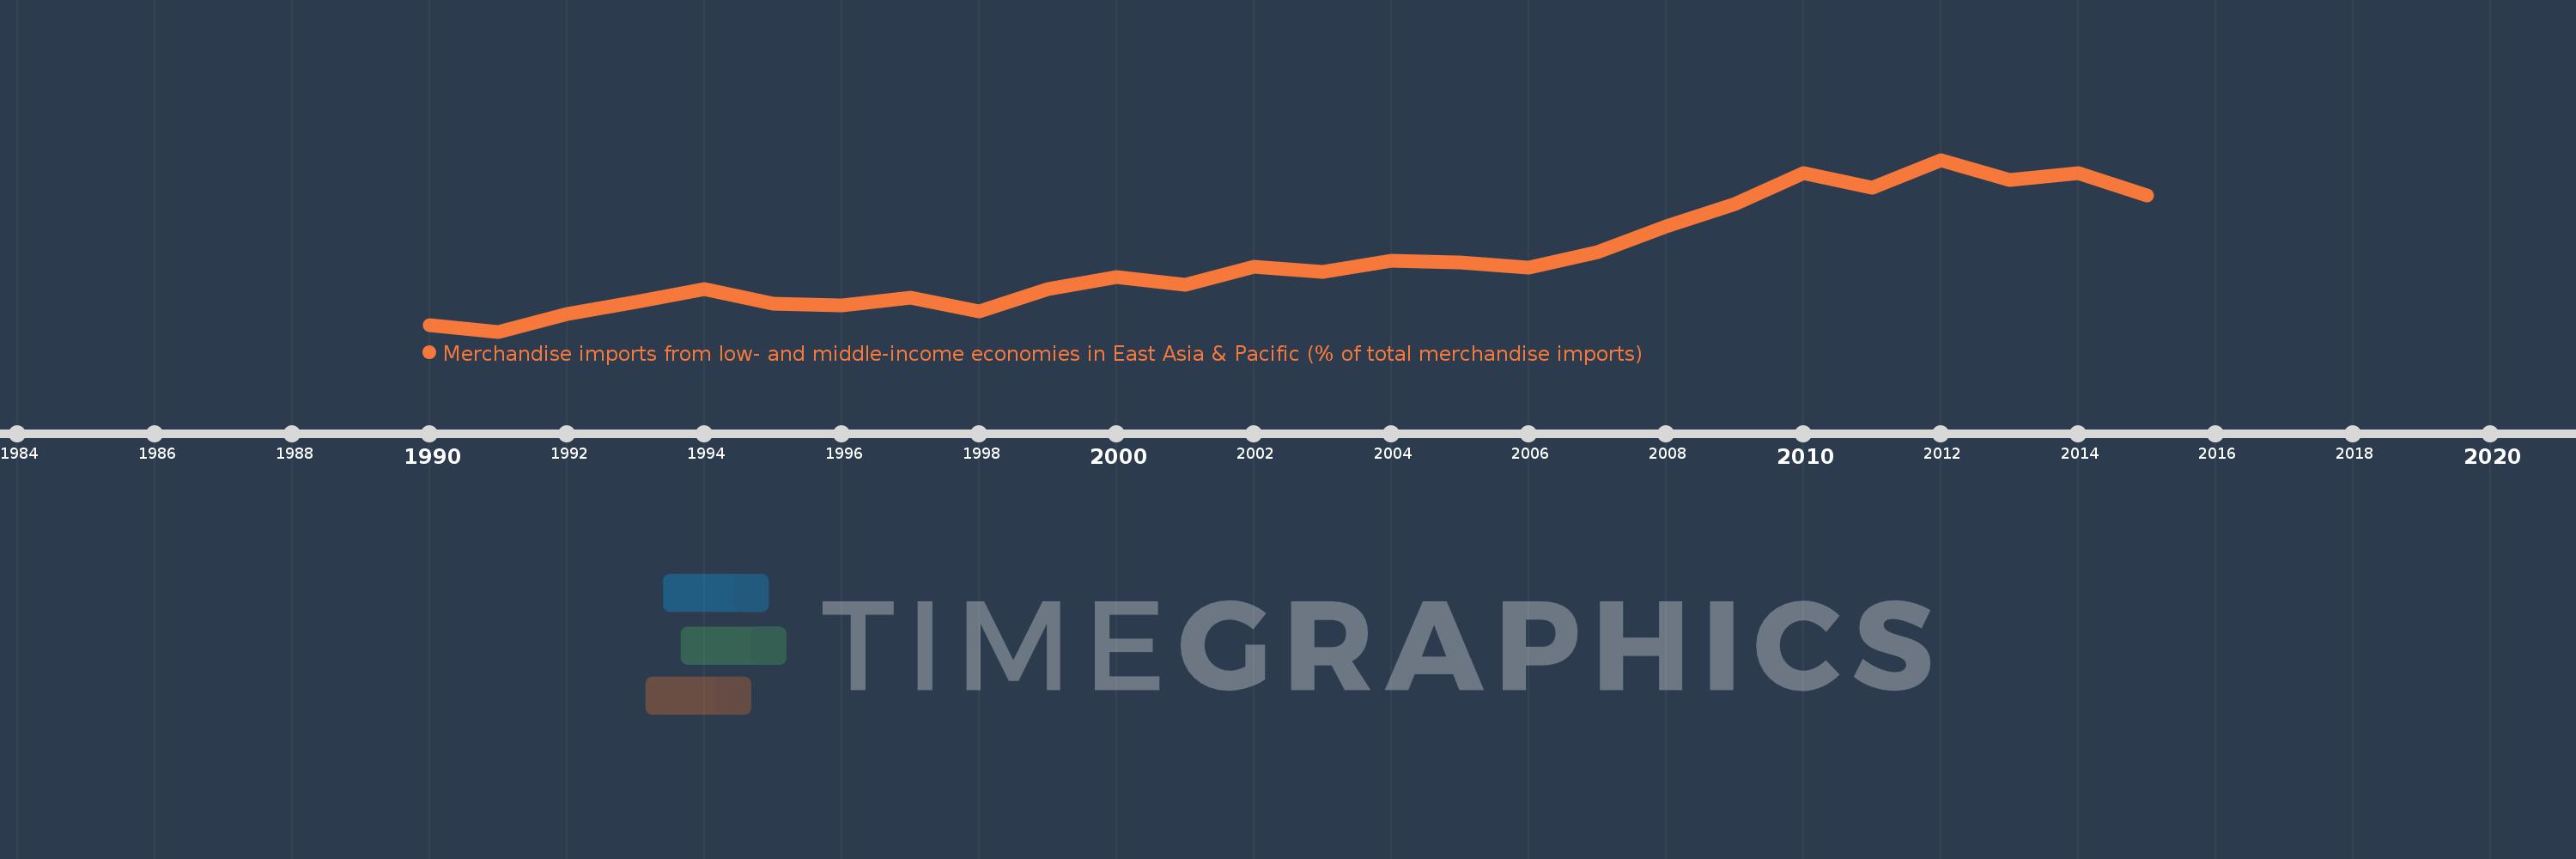
Merchandise imports from low- and middle-income economies in East Asia & Pacific (% of total merchandise imports)
2015,2014,2013,2012,2011,2010,2009,2008,2007,2006,2005,2004,2003,2002,2001,2000,1999,1998,1997,1996,1995,1994,1993,1992,1991,1990
This statistics in other country:
AfghanistanAlbaniaAlgeriaArab WorldArgentinaArmeniaArubaAustraliaAustriaAzerbaijanBahamas, TheBahrainBangladeshBarbadosBelarusBelgiumBelizeBeninBermudaBoliviaBrazilBrunei DarussalamBulgariaBurkina FasoBurundiCabo VerdeCambodiaCameroonCanadaCaribbean small statesCentral African RepublicCentral Europe and the BalticsChileChinaColombiaCongo, Rep.Costa RicaCote d'IvoireCroatiaCyprusCzech RepublicDenmarkDominicaDominican RepublicEarly-demographic dividendEast Asia & PacificEast Asia & Pacific (excluding high income)East Asia & Pacific (IDA & IBRD countries)EcuadorEgypt, Arab Rep.El SalvadorEstoniaEthiopiaEuro areaEurope & Central AsiaEurope & Central Asia (excluding high income)Europe & Central Asia (IDA & IBRD countries)European UnionFijiFinlandFragile and conflict affected situationsFranceFrench PolynesiaGabonGambia, TheGeorgiaGermanyGhanaGreeceGreenlandGrenadaGuatemalaHaitiHeavily indebted poor countries (HIPC)High incomeHondurasHong Kong SAR, ChinaHungaryIBRD onlyIcelandIDA & IBRD totalIDA blendIDA onlyIDA totalIndiaIndonesiaIran, Islamic Rep.IraqIrelandIsraelItalyJamaicaJapanJordanKazakhstanKenyaKorea, Dem. People’s Rep.Korea, Rep.KuwaitKyrgyz RepublicLao PDRLate-demographic dividendLatin America & Caribbean Latin America & Caribbean (excluding high income)Latin America & the Caribbean (IDA & IBRD countries)LatviaLeast developed countries: UN classificationLebanonLithuaniaLow & middle incomeLow incomeLower middle incomeLuxembourgMacao SAR, ChinaMacedonia, FYRMadagascarMalaysiaMaliMaltaMauritiusMexicoMiddle East & North AfricaMiddle East & North Africa (excluding high income)Middle East & North Africa (IDA & IBRD countries)Middle incomeMoldovaMongoliaMontenegroMoroccoMyanmarNetherlandsNew CaledoniaNew ZealandNicaraguaNigerNigeriaNorth AmericaNorwayOECD membersOmanOther small statesPacific island small statesPakistanPanamaPapua New GuineaParaguayPeruPhilippinesPolandPortugalPost-demographic dividendPre-demographic dividendQatarRomaniaRussian FederationSamoaSaudi ArabiaSenegalSerbiaSingaporeSlovak RepublicSloveniaSmall statesSolomon IslandsSomaliaSouth AfricaSouth AsiaSouth Asia (IDA & IBRD)SpainSri LankaSt. Kitts and NevisSt. LuciaSt. Vincent and the GrenadinesSub-Saharan Africa Sub-Saharan Africa (excluding high income)Sub-Saharan Africa (IDA & IBRD countries)SurinameSwedenSwitzerlandTanzaniaThailandTogoTongaTrinidad and TobagoTunisiaTurkeyUgandaUkraineUnited Arab EmiratesUnited KingdomUnited StatesUpper middle incomeUruguayVanuatuVenezuela, RBVietnamWorldYemen, Rep.ZambiaZimbabwe Timeline:
This timeline shows a graph from 1990 to 2015 of Cote d'Ivoire. No data until 1989. Number of actual observations by date: 26.
Source name:
World Development Indicators
Source organization:
World Bank staff estimates based data from International Monetary Fund's Direction of Trade database.
Categories, topics:
Private Sector, Trade
Last updated:
apr 23, 2017
Indicators value changes by year
Maximum:
17.365
jan 1, 2012
At the date of observation
Value
Absolute change
Change from previous value
jan 1, 1990
1.749
+1.749
0.0%
jan 1, 1991
1.146
-0.603
-34.49%
jan 1, 1992
2.841
+1.695
147.91%
jan 1, 1993
3.974
+1.133
39.87%
jan 1, 1994
5.12
+1.146
28.83%
jan 1, 1995
3.773
-1.346
-26.3%
jan 1, 1996
3.602
-0.171
-4.53%
jan 1, 1997
4.361
+0.759
21.06%
jan 1, 1998
3.063
-1.298
-29.77%
jan 1, 1999
5.2
+2.137
69.78%
jan 1, 2000
6.335
+1.135
21.82%
jan 1, 2001
5.552
-0.783
-12.35%
jan 1, 2002
7.299
+1.747
31.47%
jan 1, 2003
6.775
-0.525
-7.19%
jan 1, 2004
7.83
+1.055
15.58%
jan 1, 2005
7.661
-0.169
-2.15%
jan 1, 2006
7.217
-0.444
-5.79%
jan 1, 2007
8.668
+1.451
20.11%
jan 1, 2008
11.045
+2.377
27.42%
jan 1, 2009
13.184
+2.138
19.36%
jan 1, 2010
16.132
+2.949
22.37%
jan 1, 2011
14.737
-1.395
-8.65%
jan 1, 2012
17.365
+2.628
17.83%
jan 1, 2013
15.469
-1.897
-10.92%
jan 1, 2014
16.092
+0.623
4.03%
jan 1, 2015
14.039
-2.052
-12.75%
Ranking of countries by current statistics by years


Comments: