29
/
en
AIzaSyAYiBZKx7MnpbEhh9jyipgxe19OcubqV5w
April 1, 2024
211985
Niger
NER
true
2
1
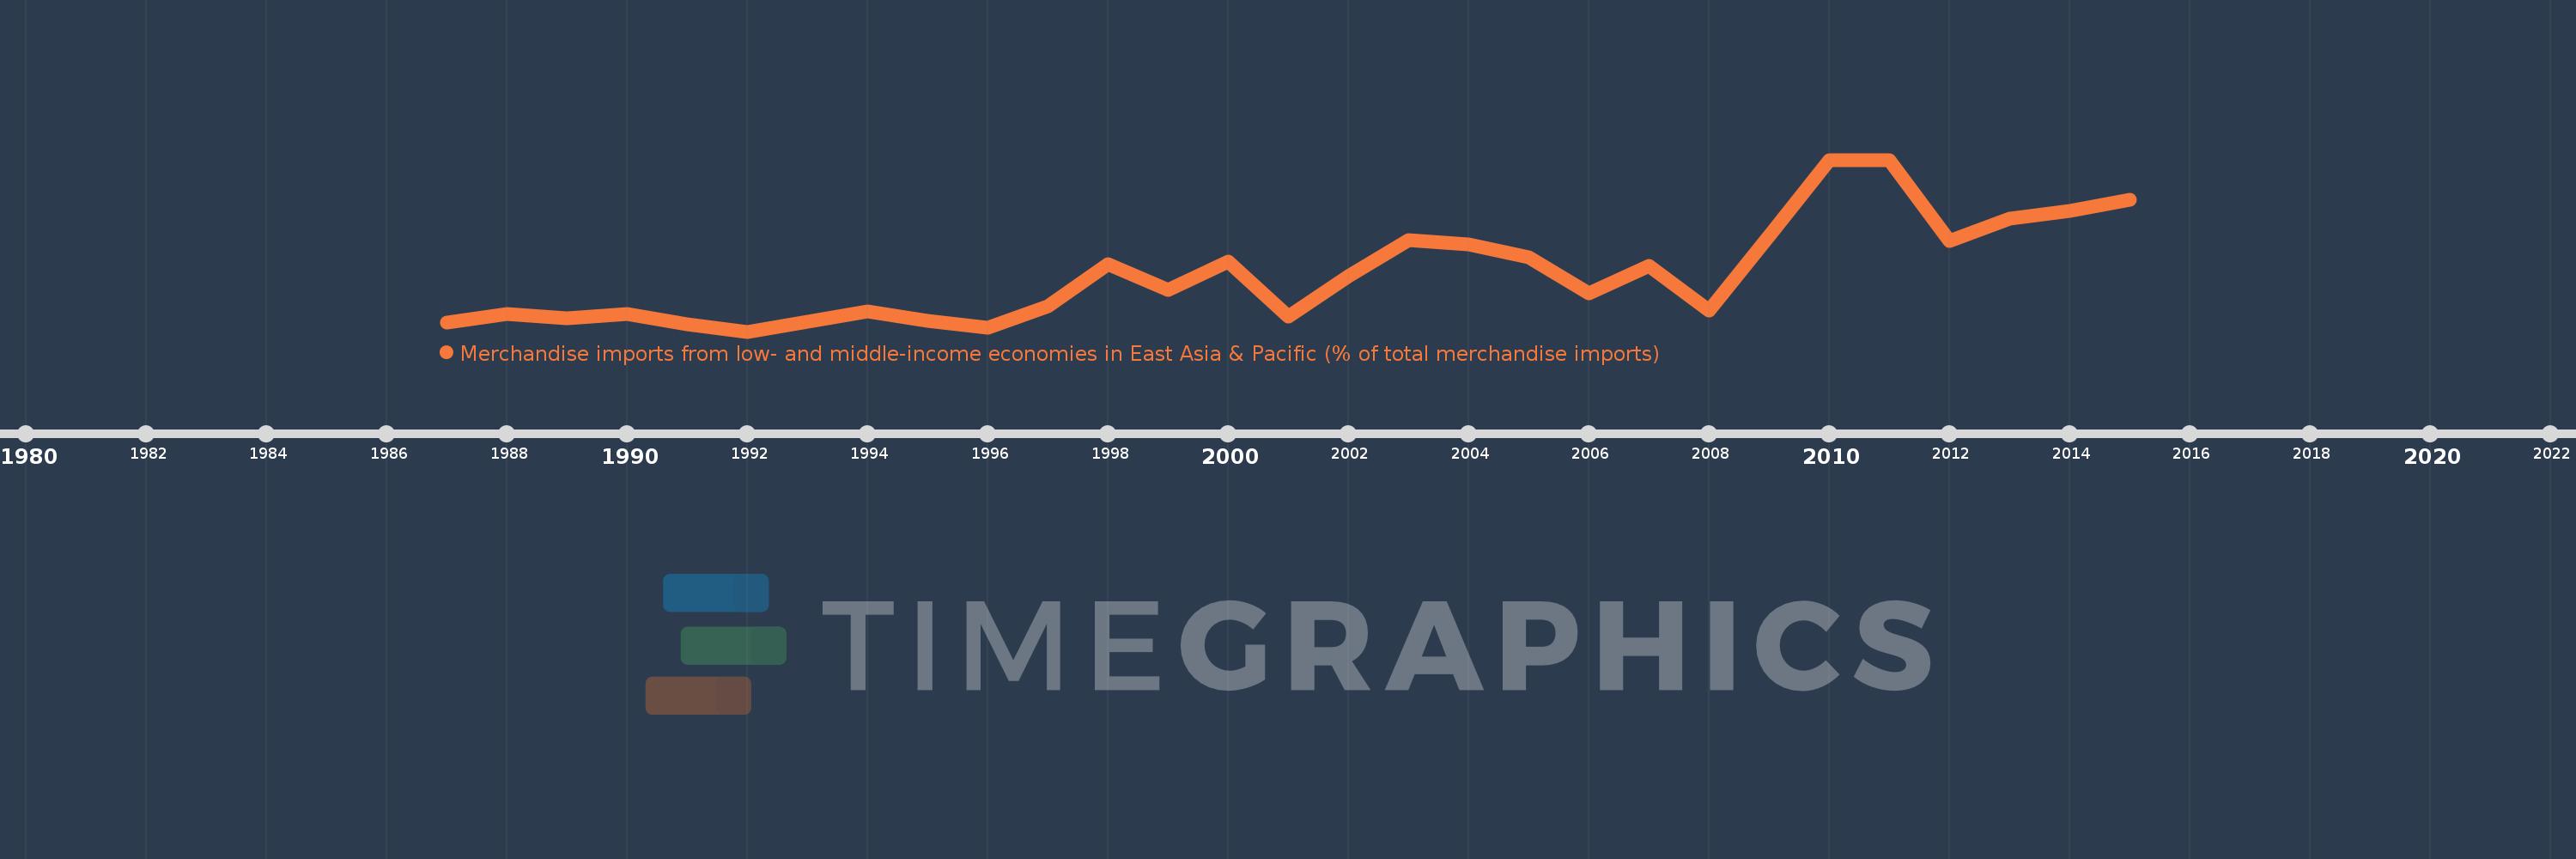
Merchandise imports from low- and middle-income economies in East Asia & Pacific (% of total merchandise imports)
2015,2014,2013,2012,2011,2010,2009,2008,2007,2006,2005,2004,2003,2002,2001,2000,1999,1998,1997,1996,1995,1994,1993,1992,1991,1990,1989,1988,1987
This statistics in other country:
AfghanistanAlbaniaAlgeriaArab WorldArgentinaArmeniaArubaAustraliaAustriaAzerbaijanBahamas, TheBahrainBangladeshBarbadosBelarusBelgiumBelizeBeninBermudaBoliviaBrazilBrunei DarussalamBulgariaBurkina FasoBurundiCabo VerdeCambodiaCameroonCanadaCaribbean small statesCentral African RepublicCentral Europe and the BalticsChileChinaColombiaCongo, Rep.Costa RicaCote d'IvoireCroatiaCyprusCzech RepublicDenmarkDominicaDominican RepublicEarly-demographic dividendEast Asia & PacificEast Asia & Pacific (excluding high income)East Asia & Pacific (IDA & IBRD countries)EcuadorEgypt, Arab Rep.El SalvadorEstoniaEthiopiaEuro areaEurope & Central AsiaEurope & Central Asia (excluding high income)Europe & Central Asia (IDA & IBRD countries)European UnionFijiFinlandFragile and conflict affected situationsFranceFrench PolynesiaGabonGambia, TheGeorgiaGermanyGhanaGreeceGreenlandGrenadaGuatemalaHaitiHeavily indebted poor countries (HIPC)High incomeHondurasHong Kong SAR, ChinaHungaryIBRD onlyIcelandIDA & IBRD totalIDA blendIDA onlyIDA totalIndiaIndonesiaIran, Islamic Rep.IraqIrelandIsraelItalyJamaicaJapanJordanKazakhstanKenyaKorea, Dem. People’s Rep.Korea, Rep.KuwaitKyrgyz RepublicLao PDRLate-demographic dividendLatin America & Caribbean Latin America & Caribbean (excluding high income)Latin America & the Caribbean (IDA & IBRD countries)LatviaLeast developed countries: UN classificationLebanonLithuaniaLow & middle incomeLow incomeLower middle incomeLuxembourgMacao SAR, ChinaMacedonia, FYRMadagascarMalaysiaMaliMaltaMauritiusMexicoMiddle East & North AfricaMiddle East & North Africa (excluding high income)Middle East & North Africa (IDA & IBRD countries)Middle incomeMoldovaMongoliaMontenegroMoroccoMyanmarNetherlandsNew CaledoniaNew ZealandNicaraguaNigerNigeriaNorth AmericaNorwayOECD membersOmanOther small statesPacific island small statesPakistanPanamaPapua New GuineaParaguayPeruPhilippinesPolandPortugalPost-demographic dividendPre-demographic dividendQatarRomaniaRussian FederationSamoaSaudi ArabiaSenegalSerbiaSingaporeSlovak RepublicSloveniaSmall statesSolomon IslandsSomaliaSouth AfricaSouth AsiaSouth Asia (IDA & IBRD)SpainSri LankaSt. Kitts and NevisSt. LuciaSt. Vincent and the GrenadinesSub-Saharan Africa Sub-Saharan Africa (excluding high income)Sub-Saharan Africa (IDA & IBRD countries)SurinameSwedenSwitzerlandTanzaniaThailandTogoTongaTrinidad and TobagoTunisiaTurkeyUgandaUkraineUnited Arab EmiratesUnited KingdomUnited StatesUpper middle incomeUruguayVanuatuVenezuela, RBVietnamWorldYemen, Rep.ZambiaZimbabwe Timeline:
This timeline shows a graph from 1987 to 2015 of Niger. No data until 1986. Number of actual observations by date: 29.
Source name:
World Development Indicators
Source organization:
World Bank staff estimates based data from International Monetary Fund's Direction of Trade database.
Categories, topics:
Private Sector, Trade
Last updated:
apr 23, 2017
Indicators value changes by year
Maximum:
21.181
jan 1, 2011
At the date of observation
Value
Absolute change
Change from previous value
jan 1, 1987
2.843
+2.843
0.0%
jan 1, 1988
3.819
+0.976
34.33%
jan 1, 1989
3.318
-0.501
-13.11%
jan 1, 1990
3.835
+0.517
15.59%
jan 1, 1991
2.668
-1.167
-30.44%
jan 1, 1992
1.818
-0.85
-31.87%
jan 1, 1993
2.919
+1.101
60.59%
jan 1, 1994
4.053
+1.134
38.84%
jan 1, 1995
2.981
-1.072
-26.46%
jan 1, 1996
2.244
-0.737
-24.73%
jan 1, 1997
4.674
+2.43
108.32%
jan 1, 1998
9.407
+4.733
101.27%
jan 1, 1999
6.554
-2.853
-30.33%
jan 1, 2000
9.691
+3.138
47.87%
jan 1, 2001
3.477
-6.214
-64.12%
jan 1, 2002
8.11
+4.633
133.23%
jan 1, 2003
12.1
+3.99
49.2%
jan 1, 2004
11.649
-0.451
-3.73%
jan 1, 2005
10.197
-1.452
-12.46%
jan 1, 2006
6.15
-4.047
-39.69%
jan 1, 2007
9.254
+3.104
50.47%
jan 1, 2008
4.212
-5.042
-54.49%
jan 1, 2009
12.585
+8.373
198.8%
jan 1, 2010
21.122
+8.537
67.84%
jan 1, 2011
21.181
+0.059
0.28%
jan 1, 2012
11.988
-9.193
-43.4%
jan 1, 2013
14.526
+2.538
21.17%
jan 1, 2014
15.463
+0.937
6.45%
jan 1, 2015
16.725
+1.263
8.17%
Ranking of countries by current statistics by years


Comments: