29
/
en
AIzaSyAYiBZKx7MnpbEhh9jyipgxe19OcubqV5w
April 1, 2024
201868
Morocco
MAR
true
2
1
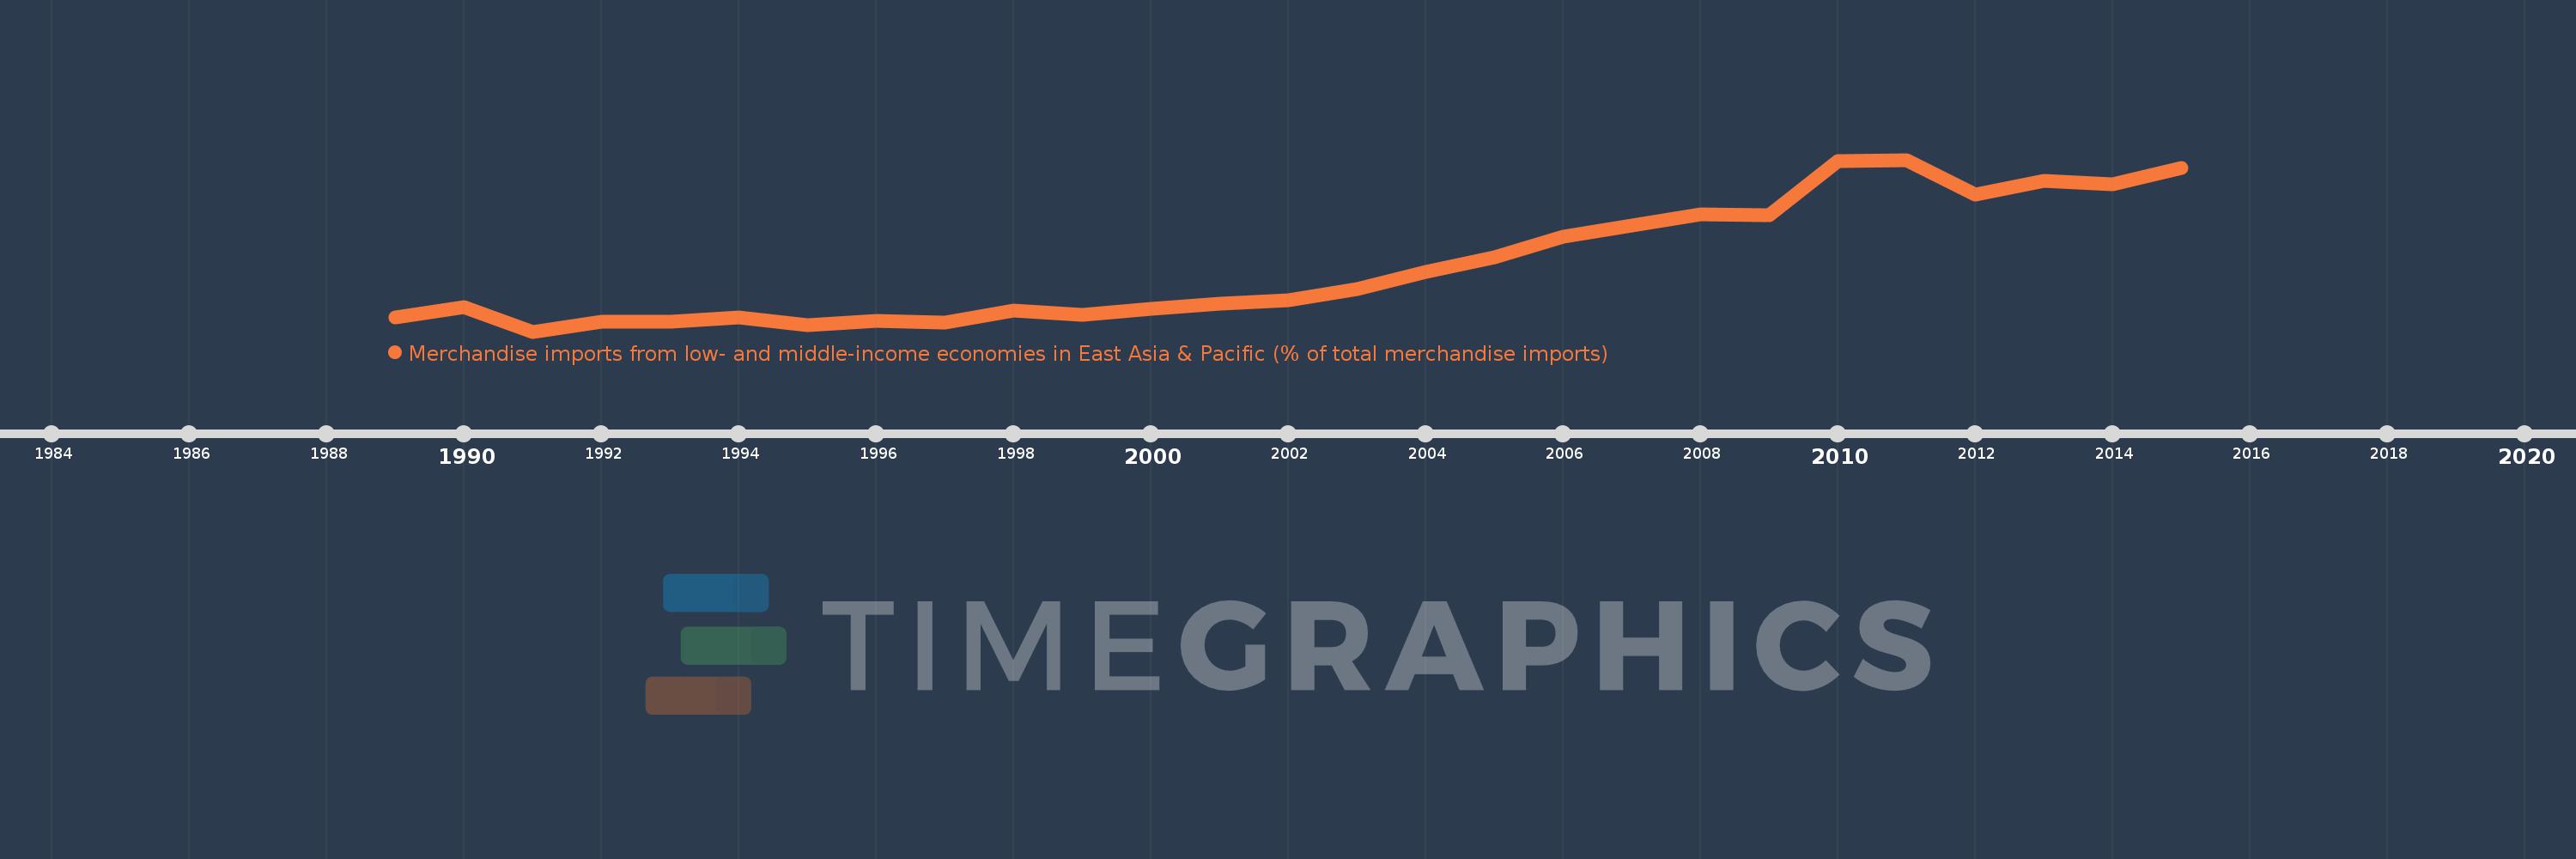
Merchandise imports from low- and middle-income economies in East Asia & Pacific (% of total merchandise imports)
2015,2014,2013,2012,2011,2010,2009,2008,2007,2006,2005,2004,2003,2002,2001,2000,1999,1998,1997,1996,1995,1994,1993,1992,1991,1990,1989
This statistics in other country:
AfghanistanAlbaniaAlgeriaArab WorldArgentinaArmeniaArubaAustraliaAustriaAzerbaijanBahamas, TheBahrainBangladeshBarbadosBelarusBelgiumBelizeBeninBermudaBoliviaBrazilBrunei DarussalamBulgariaBurkina FasoBurundiCabo VerdeCambodiaCameroonCanadaCaribbean small statesCentral African RepublicCentral Europe and the BalticsChileChinaColombiaCongo, Rep.Costa RicaCote d'IvoireCroatiaCyprusCzech RepublicDenmarkDominicaDominican RepublicEarly-demographic dividendEast Asia & PacificEast Asia & Pacific (excluding high income)East Asia & Pacific (IDA & IBRD countries)EcuadorEgypt, Arab Rep.El SalvadorEstoniaEthiopiaEuro areaEurope & Central AsiaEurope & Central Asia (excluding high income)Europe & Central Asia (IDA & IBRD countries)European UnionFijiFinlandFragile and conflict affected situationsFranceFrench PolynesiaGabonGambia, TheGeorgiaGermanyGhanaGreeceGreenlandGrenadaGuatemalaHaitiHeavily indebted poor countries (HIPC)High incomeHondurasHong Kong SAR, ChinaHungaryIBRD onlyIcelandIDA & IBRD totalIDA blendIDA onlyIDA totalIndiaIndonesiaIran, Islamic Rep.IraqIrelandIsraelItalyJamaicaJapanJordanKazakhstanKenyaKorea, Dem. People’s Rep.Korea, Rep.KuwaitKyrgyz RepublicLao PDRLate-demographic dividendLatin America & Caribbean Latin America & Caribbean (excluding high income)Latin America & the Caribbean (IDA & IBRD countries)LatviaLeast developed countries: UN classificationLebanonLithuaniaLow & middle incomeLow incomeLower middle incomeLuxembourgMacao SAR, ChinaMacedonia, FYRMadagascarMalaysiaMaliMaltaMauritiusMexicoMiddle East & North AfricaMiddle East & North Africa (excluding high income)Middle East & North Africa (IDA & IBRD countries)Middle incomeMoldovaMongoliaMontenegroMoroccoMyanmarNetherlandsNew CaledoniaNew ZealandNicaraguaNigerNigeriaNorth AmericaNorwayOECD membersOmanOther small statesPacific island small statesPakistanPanamaPapua New GuineaParaguayPeruPhilippinesPolandPortugalPost-demographic dividendPre-demographic dividendQatarRomaniaRussian FederationSamoaSaudi ArabiaSenegalSerbiaSingaporeSlovak RepublicSloveniaSmall statesSolomon IslandsSomaliaSouth AfricaSouth AsiaSouth Asia (IDA & IBRD)SpainSri LankaSt. Kitts and NevisSt. LuciaSt. Vincent and the GrenadinesSub-Saharan Africa Sub-Saharan Africa (excluding high income)Sub-Saharan Africa (IDA & IBRD countries)SurinameSwedenSwitzerlandTanzaniaThailandTogoTongaTrinidad and TobagoTunisiaTurkeyUgandaUkraineUnited Arab EmiratesUnited KingdomUnited StatesUpper middle incomeUruguayVanuatuVenezuela, RBVietnamWorldYemen, Rep.ZambiaZimbabwe Timeline:
This timeline shows a graph from 1989 to 2015 of Morocco. No data until 1988. Number of actual observations by date: 27.
Source name:
World Development Indicators
Source organization:
World Bank staff estimates based data from International Monetary Fund's Direction of Trade database.
Categories, topics:
Private Sector, Trade
Last updated:
apr 23, 2017
Indicators value changes by year
At the date of observation
Value
Absolute change
Change from previous value
jan 1, 1989
2.498
+2.498
0.0%
jan 1, 1990
2.931
+0.433
17.32%
jan 1, 1991
1.877
-1.054
-35.95%
jan 1, 1992
2.304
+0.427
22.72%
jan 1, 1993
2.281
-0.022
-0.97%
jan 1, 1994
2.48
+0.199
8.7%
jan 1, 1995
2.139
-0.341
-13.76%
jan 1, 1996
2.341
+0.202
9.45%
jan 1, 1997
2.262
-0.079
-3.37%
jan 1, 1998
2.779
+0.517
22.86%
jan 1, 1999
2.576
-0.203
-7.3%
jan 1, 2000
2.847
+0.271
10.53%
jan 1, 2001
3.075
+0.228
8.0%
jan 1, 2002
3.22
+0.145
4.73%
jan 1, 2003
3.679
+0.459
14.24%
jan 1, 2004
4.431
+0.752
20.43%
jan 1, 2005
5.063
+0.632
14.26%
jan 1, 2006
5.927
+0.865
17.08%
jan 1, 2007
6.387
+0.46
7.75%
jan 1, 2008
6.873
+0.487
7.62%
jan 1, 2009
6.845
-0.028
-0.41%
jan 1, 2010
9.137
+2.292
33.48%
jan 1, 2011
9.206
+0.069
0.76%
jan 1, 2012
7.726
-1.48
-16.08%
jan 1, 2013
8.315
+0.588
7.61%
jan 1, 2014
8.161
-0.154
-1.85%
jan 1, 2015
8.876
+0.715
8.76%
Ranking of countries by current statistics by years


Comments: