29
/
en
AIzaSyAYiBZKx7MnpbEhh9jyipgxe19OcubqV5w
April 1, 2024
25093
Caribbean small states
CSS
false
2
1
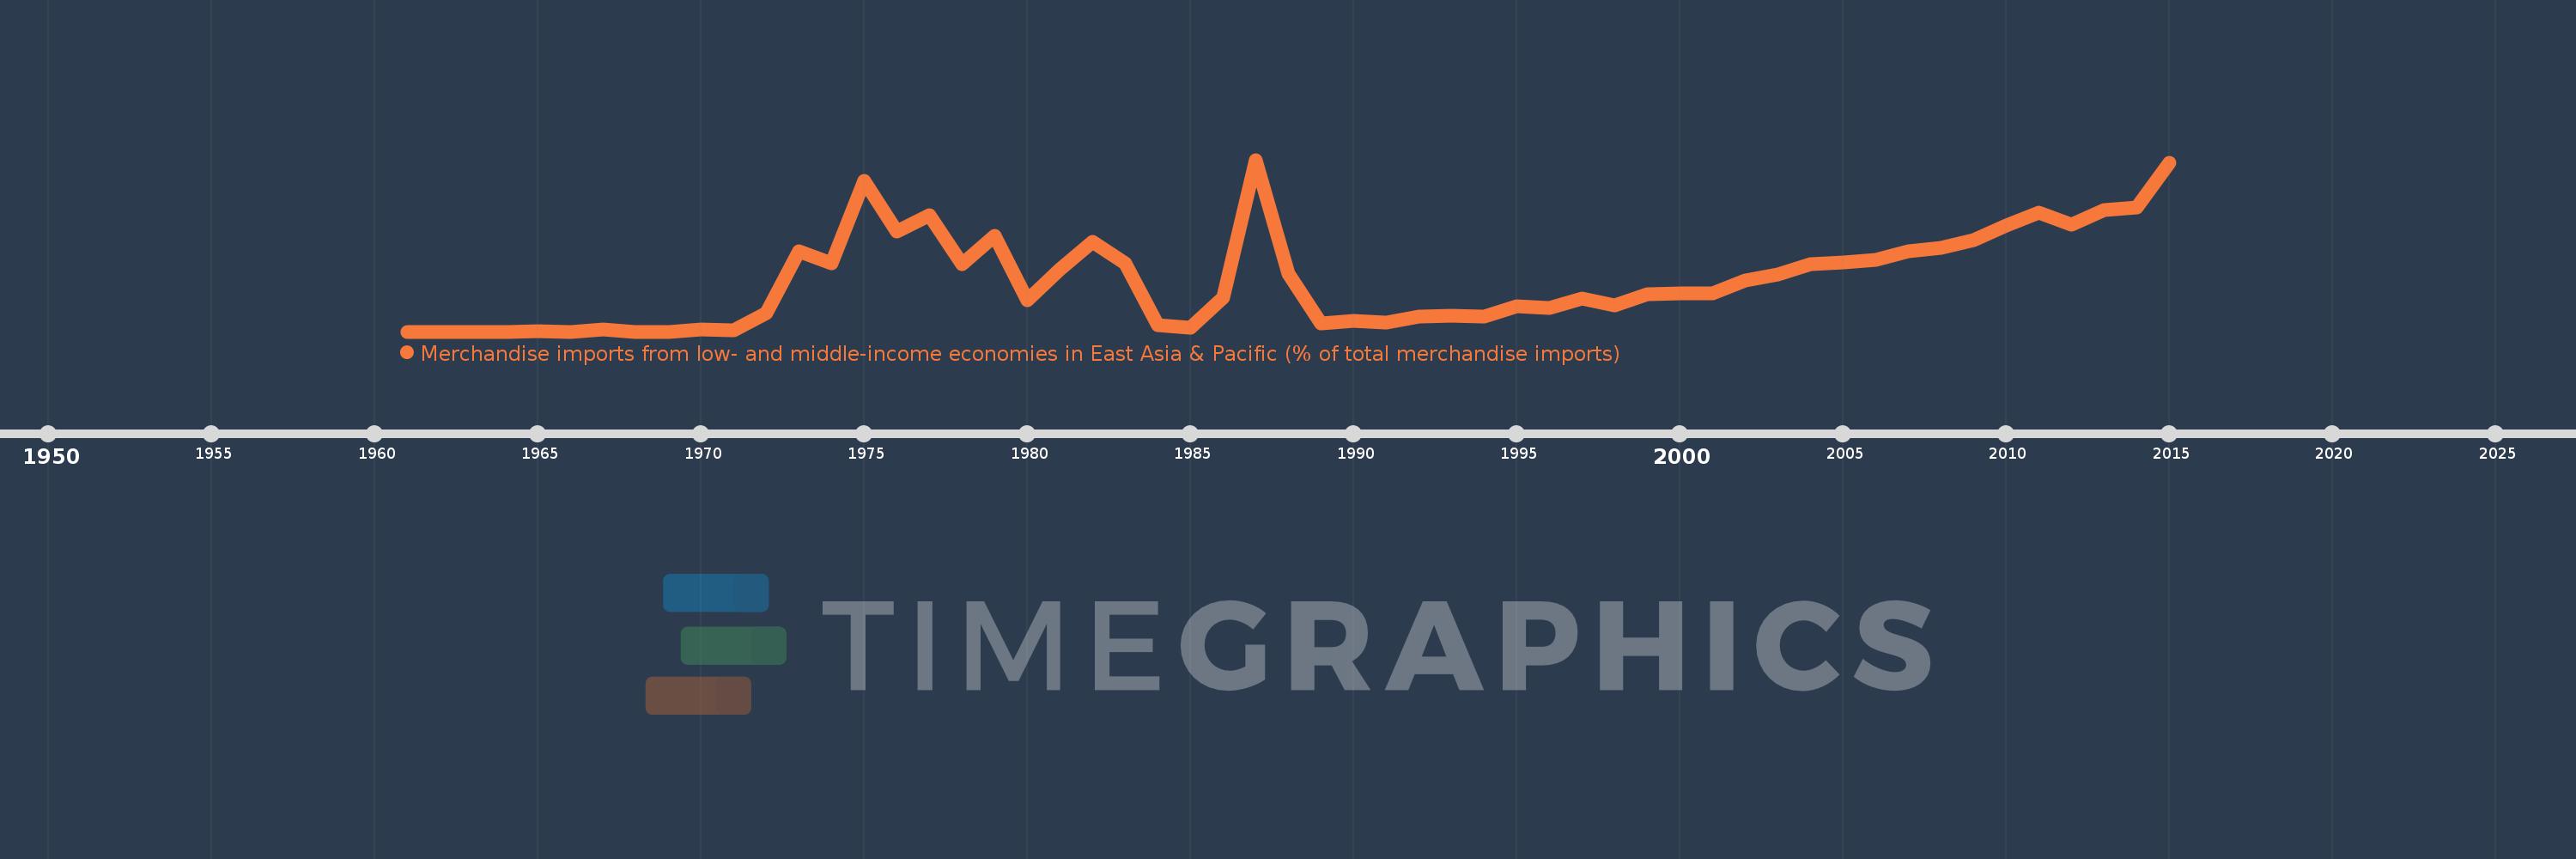
Merchandise imports from low- and middle-income economies in East Asia & Pacific (% of total merchandise imports)
2015,2014,2013,2012,2011,2010,2009,2008,2007,2006,2005,2004,2003,2002,2001,2000,1999,1998,1997,1996,1995,1994,1993,1992,1991,1990,1989,1988,1987,1986,1985,1984,1983,1982,1981,1980,1979,1978,1977,1976,1975,1974,1973,1972,1971,1970,1969,1968,1967,1966,1965,1964,1963,1962,1961
This statistics in other country:
AfghanistanAlbaniaAlgeriaArab WorldArgentinaArmeniaArubaAustraliaAustriaAzerbaijanBahamas, TheBahrainBangladeshBarbadosBelarusBelgiumBelizeBeninBermudaBoliviaBrazilBrunei DarussalamBulgariaBurkina FasoBurundiCabo VerdeCambodiaCameroonCanadaCaribbean small statesCentral African RepublicCentral Europe and the BalticsChileChinaColombiaCongo, Rep.Costa RicaCote d'IvoireCroatiaCyprusCzech RepublicDenmarkDominicaDominican RepublicEarly-demographic dividendEast Asia & PacificEast Asia & Pacific (excluding high income)East Asia & Pacific (IDA & IBRD countries)EcuadorEgypt, Arab Rep.El SalvadorEstoniaEthiopiaEuro areaEurope & Central AsiaEurope & Central Asia (excluding high income)Europe & Central Asia (IDA & IBRD countries)European UnionFijiFinlandFragile and conflict affected situationsFranceFrench PolynesiaGabonGambia, TheGeorgiaGermanyGhanaGreeceGreenlandGrenadaGuatemalaHaitiHeavily indebted poor countries (HIPC)High incomeHondurasHong Kong SAR, ChinaHungaryIBRD onlyIcelandIDA & IBRD totalIDA blendIDA onlyIDA totalIndiaIndonesiaIran, Islamic Rep.IraqIrelandIsraelItalyJamaicaJapanJordanKazakhstanKenyaKorea, Dem. People’s Rep.Korea, Rep.KuwaitKyrgyz RepublicLao PDRLate-demographic dividendLatin America & Caribbean Latin America & Caribbean (excluding high income)Latin America & the Caribbean (IDA & IBRD countries)LatviaLeast developed countries: UN classificationLebanonLithuaniaLow & middle incomeLow incomeLower middle incomeLuxembourgMacao SAR, ChinaMacedonia, FYRMadagascarMalaysiaMaliMaltaMauritiusMexicoMiddle East & North AfricaMiddle East & North Africa (excluding high income)Middle East & North Africa (IDA & IBRD countries)Middle incomeMoldovaMongoliaMontenegroMoroccoMyanmarNetherlandsNew CaledoniaNew ZealandNicaraguaNigerNigeriaNorth AmericaNorwayOECD membersOmanOther small statesPacific island small statesPakistanPanamaPapua New GuineaParaguayPeruPhilippinesPolandPortugalPost-demographic dividendPre-demographic dividendQatarRomaniaRussian FederationSamoaSaudi ArabiaSenegalSerbiaSingaporeSlovak RepublicSloveniaSmall statesSolomon IslandsSomaliaSouth AfricaSouth AsiaSouth Asia (IDA & IBRD)SpainSri LankaSt. Kitts and NevisSt. LuciaSt. Vincent and the GrenadinesSub-Saharan Africa Sub-Saharan Africa (excluding high income)Sub-Saharan Africa (IDA & IBRD countries)SurinameSwedenSwitzerlandTanzaniaThailandTogoTongaTrinidad and TobagoTunisiaTurkeyUgandaUkraineUnited Arab EmiratesUnited KingdomUnited StatesUpper middle incomeUruguayVanuatuVenezuela, RBVietnamWorldYemen, Rep.ZambiaZimbabwe Timeline:
This timeline shows a graph from 1961 to 2015 of Caribbean small states. No data until 1960. Number of actual observations by date: 55.
Source name:
World Development Indicators
Source organization:
World Bank staff estimates based data from International Monetary Fund's Direction of Trade database.
Categories, topics:
Private Sector, Trade
Last updated:
apr 23, 2017
Indicators value changes by year
At the date of observation
Value
Absolute change
Change from previous value
jan 1, 1965
0.019
+0.019
%
jan 1, 1966
0.0
-0.019
-100.0%
jan 1, 1967
0.098
+0.098
%
jan 1, 1968
0.0
-0.098
-100.0%
jan 1, 1971
0.053
-0.017
-23.72%
jan 1, 1972
0.751
+0.698
1.3K%
jan 1, 1973
3.268
+2.517
335.15%
jan 1, 1974
2.782
-0.486
-14.88%
jan 1, 1975
6.124
+3.342
120.11%
jan 1, 1976
4.068
-2.056
-33.58%
jan 1, 1977
4.733
+0.665
16.36%
jan 1, 1978
2.746
-1.987
-41.99%
jan 1, 1979
3.893
+1.147
41.79%
jan 1, 1980
1.273
-2.62
-67.29%
jan 1, 1981
2.537
+1.264
99.26%
jan 1, 1982
3.648
+1.11
43.77%
jan 1, 1983
2.774
-0.874
-23.96%
jan 1, 1984
0.251
-2.523
-90.97%
jan 1, 1985
0.161
-0.089
-35.66%
jan 1, 1986
1.364
+1.202
745.71%
jan 1, 1987
6.98
+5.616
411.89%
jan 1, 1988
2.372
-4.607
-66.01%
jan 1, 1989
0.331
-2.041
-86.03%
jan 1, 1990
0.433
+0.102
30.68%
jan 1, 1991
0.373
-0.06
-13.78%
jan 1, 1992
0.622
+0.248
66.51%
jan 1, 1993
0.631
+0.009
1.5%
jan 1, 1994
0.617
-0.014
-2.26%
jan 1, 1995
1.041
+0.424
68.82%
jan 1, 1996
0.973
-0.068
-6.5%
jan 1, 1997
1.331
+0.357
36.67%
jan 1, 1998
1.048
-0.282
-21.21%
jan 1, 1999
1.514
+0.466
44.47%
jan 1, 2000
1.545
+0.03
2.0%
jan 1, 2001
1.55
+0.006
0.37%
jan 1, 2002
2.085
+0.534
34.46%
jan 1, 2003
2.331
+0.246
11.81%
jan 1, 2004
2.725
+0.394
16.9%
jan 1, 2005
2.812
+0.087
3.19%
jan 1, 2006
2.924
+0.113
4.0%
jan 1, 2007
3.279
+0.355
12.13%
jan 1, 2008
3.407
+0.128
3.91%
jan 1, 2009
3.722
+0.315
9.25%
jan 1, 2010
4.322
+0.6
16.11%
jan 1, 2011
4.825
+0.503
11.64%
jan 1, 2012
4.35
-0.475
-9.84%
jan 1, 2013
4.945
+0.595
13.68%
jan 1, 2014
5.027
+0.081
1.65%
jan 1, 2015
6.871
+1.845
36.7%
Ranking of countries by current statistics by years


Comments: