29
/
en
AIzaSyAYiBZKx7MnpbEhh9jyipgxe19OcubqV5w
April 1, 2024
101344
Canada
CAN
true
2
1
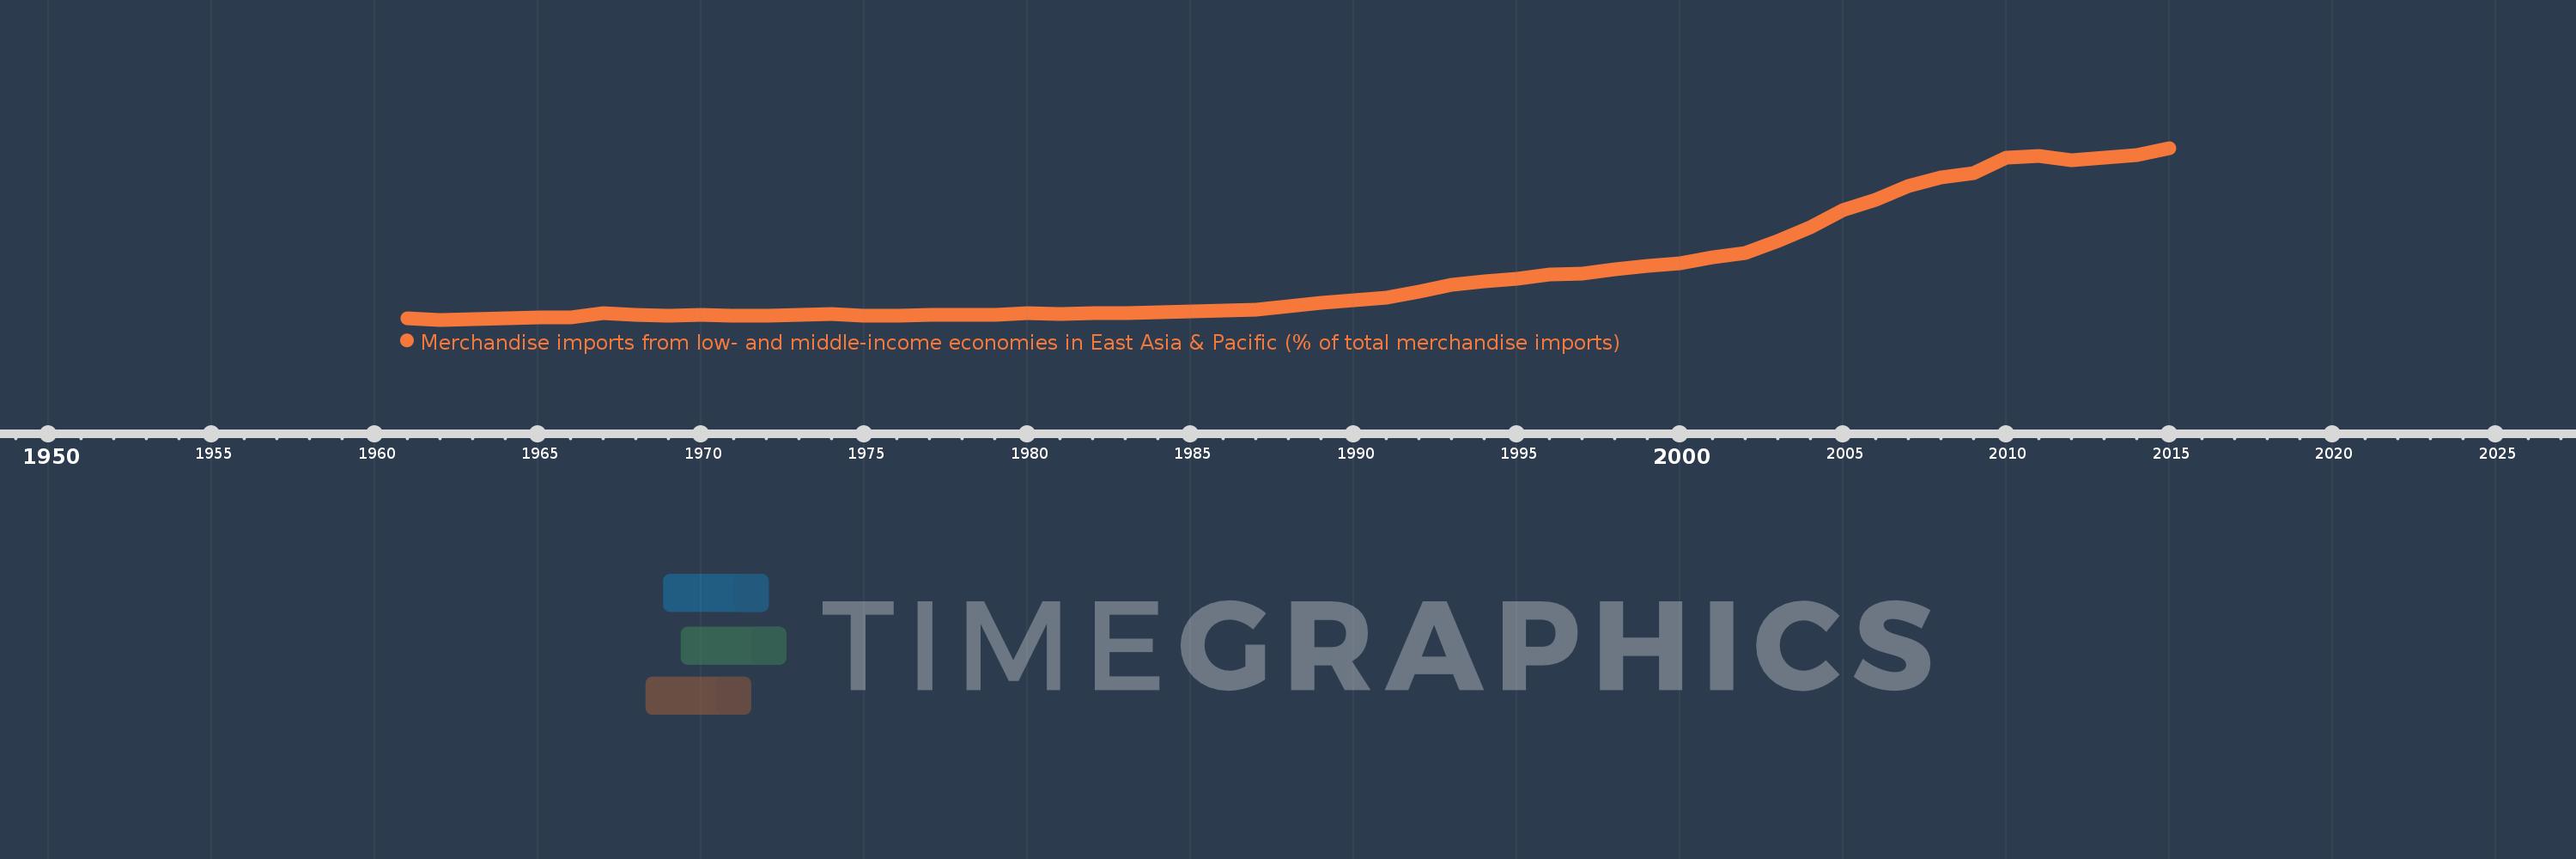
Merchandise imports from low- and middle-income economies in East Asia & Pacific (% of total merchandise imports)
2015,2014,2013,2012,2011,2010,2009,2008,2007,2006,2005,2004,2003,2002,2001,2000,1999,1998,1997,1996,1995,1994,1993,1992,1991,1990,1989,1988,1987,1986,1985,1984,1983,1982,1981,1980,1979,1978,1977,1976,1975,1974,1973,1972,1971,1970,1969,1968,1967,1966,1965,1964,1963,1962,1961
This statistics in other country:
AfghanistanAlbaniaAlgeriaArab WorldArgentinaArmeniaArubaAustraliaAustriaAzerbaijanBahamas, TheBahrainBangladeshBarbadosBelarusBelgiumBelizeBeninBermudaBoliviaBrazilBrunei DarussalamBulgariaBurkina FasoBurundiCabo VerdeCambodiaCameroonCanadaCaribbean small statesCentral African RepublicCentral Europe and the BalticsChileChinaColombiaCongo, Rep.Costa RicaCote d'IvoireCroatiaCyprusCzech RepublicDenmarkDominicaDominican RepublicEarly-demographic dividendEast Asia & PacificEast Asia & Pacific (excluding high income)East Asia & Pacific (IDA & IBRD countries)EcuadorEgypt, Arab Rep.El SalvadorEstoniaEthiopiaEuro areaEurope & Central AsiaEurope & Central Asia (excluding high income)Europe & Central Asia (IDA & IBRD countries)European UnionFijiFinlandFragile and conflict affected situationsFranceFrench PolynesiaGabonGambia, TheGeorgiaGermanyGhanaGreeceGreenlandGrenadaGuatemalaHaitiHeavily indebted poor countries (HIPC)High incomeHondurasHong Kong SAR, ChinaHungaryIBRD onlyIcelandIDA & IBRD totalIDA blendIDA onlyIDA totalIndiaIndonesiaIran, Islamic Rep.IraqIrelandIsraelItalyJamaicaJapanJordanKazakhstanKenyaKorea, Dem. People’s Rep.Korea, Rep.KuwaitKyrgyz RepublicLao PDRLate-demographic dividendLatin America & Caribbean Latin America & Caribbean (excluding high income)Latin America & the Caribbean (IDA & IBRD countries)LatviaLeast developed countries: UN classificationLebanonLithuaniaLow & middle incomeLow incomeLower middle incomeLuxembourgMacao SAR, ChinaMacedonia, FYRMadagascarMalaysiaMaliMaltaMauritiusMexicoMiddle East & North AfricaMiddle East & North Africa (excluding high income)Middle East & North Africa (IDA & IBRD countries)Middle incomeMoldovaMongoliaMontenegroMoroccoMyanmarNetherlandsNew CaledoniaNew ZealandNicaraguaNigerNigeriaNorth AmericaNorwayOECD membersOmanOther small statesPacific island small statesPakistanPanamaPapua New GuineaParaguayPeruPhilippinesPolandPortugalPost-demographic dividendPre-demographic dividendQatarRomaniaRussian FederationSamoaSaudi ArabiaSenegalSerbiaSingaporeSlovak RepublicSloveniaSmall statesSolomon IslandsSomaliaSouth AfricaSouth AsiaSouth Asia (IDA & IBRD)SpainSri LankaSt. Kitts and NevisSt. LuciaSt. Vincent and the GrenadinesSub-Saharan Africa Sub-Saharan Africa (excluding high income)Sub-Saharan Africa (IDA & IBRD countries)SurinameSwedenSwitzerlandTanzaniaThailandTogoTongaTrinidad and TobagoTunisiaTurkeyUgandaUkraineUnited Arab EmiratesUnited KingdomUnited StatesUpper middle incomeUruguayVanuatuVenezuela, RBVietnamWorldYemen, Rep.ZambiaZimbabwe Timeline:
This timeline shows a graph from 1961 to 2015 of Canada. No data until 1960. Number of actual observations by date: 55.
Source name:
World Development Indicators
Source organization:
World Bank staff estimates based data from International Monetary Fund's Direction of Trade database.
Categories, topics:
Private Sector, Trade
Last updated:
apr 23, 2017
Indicators value changes by year
Maximum:
13.796
jan 1, 2015
At the date of observation
Value
Absolute change
Change from previous value
jan 1, 1961
0.258
+0.258
0.0%
jan 1, 1962
0.134
-0.125
-48.25%
jan 1, 1963
0.164
+0.03
22.6%
jan 1, 1964
0.251
+0.087
53.31%
jan 1, 1965
0.29
+0.039
15.45%
jan 1, 1966
0.289
-0.001
-0.47%
jan 1, 1967
0.684
+0.396
137.18%
jan 1, 1968
0.535
-0.15
-21.84%
jan 1, 1969
0.455
-0.08
-14.87%
jan 1, 1970
0.505
+0.049
10.84%
jan 1, 1971
0.458
-0.046
-9.18%
jan 1, 1972
0.427
-0.031
-6.78%
jan 1, 1973
0.544
+0.117
27.33%
jan 1, 1974
0.583
+0.039
7.22%
jan 1, 1975
0.466
-0.118
-20.14%
jan 1, 1976
0.436
-0.029
-6.32%
jan 1, 1977
0.511
+0.074
17.01%
jan 1, 1978
0.49
-0.02
-3.96%
jan 1, 1979
0.517
+0.027
5.47%
jan 1, 1980
0.666
+0.149
28.71%
jan 1, 1981
0.596
-0.069
-10.44%
jan 1, 1982
0.632
+0.035
5.93%
jan 1, 1983
0.639
+0.008
1.2%
jan 1, 1984
0.716
+0.076
11.96%
jan 1, 1985
0.822
+0.106
14.87%
jan 1, 1986
0.849
+0.027
3.24%
jan 1, 1987
0.954
+0.105
12.34%
jan 1, 1988
1.219
+0.265
27.77%
jan 1, 1989
1.482
+0.264
21.65%
jan 1, 1990
1.693
+0.211
14.21%
jan 1, 1991
1.871
+0.178
10.48%
jan 1, 1992
2.351
+0.481
25.69%
jan 1, 1993
2.927
+0.576
24.51%
jan 1, 1994
3.214
+0.286
9.78%
jan 1, 1995
3.4
+0.186
5.79%
jan 1, 1996
3.762
+0.363
10.67%
jan 1, 1997
3.818
+0.055
1.47%
jan 1, 1998
4.116
+0.298
7.82%
jan 1, 1999
4.39
+0.274
6.66%
jan 1, 2000
4.609
+0.219
4.99%
jan 1, 2001
5.074
+0.464
10.07%
jan 1, 2002
5.419
+0.346
6.81%
jan 1, 2003
6.379
+0.96
17.72%
jan 1, 2004
7.525
+1.146
17.96%
jan 1, 2005
8.879
+1.354
18.0%
jan 1, 2006
9.699
+0.82
9.23%
jan 1, 2007
10.755
+1.057
10.89%
jan 1, 2008
11.472
+0.717
6.66%
jan 1, 2009
11.779
+0.307
2.68%
jan 1, 2010
13.034
+1.255
10.65%
jan 1, 2011
13.162
+0.128
0.98%
jan 1, 2012
12.851
-0.311
-2.36%
jan 1, 2013
13.049
+0.198
1.54%
jan 1, 2014
13.245
+0.196
1.5%
jan 1, 2015
13.796
+0.551
4.16%
Ranking of countries by current statistics by years


Comments: