29
/
en
AIzaSyAYiBZKx7MnpbEhh9jyipgxe19OcubqV5w
April 1, 2024
240693
Singapore
SGP
true
2
1
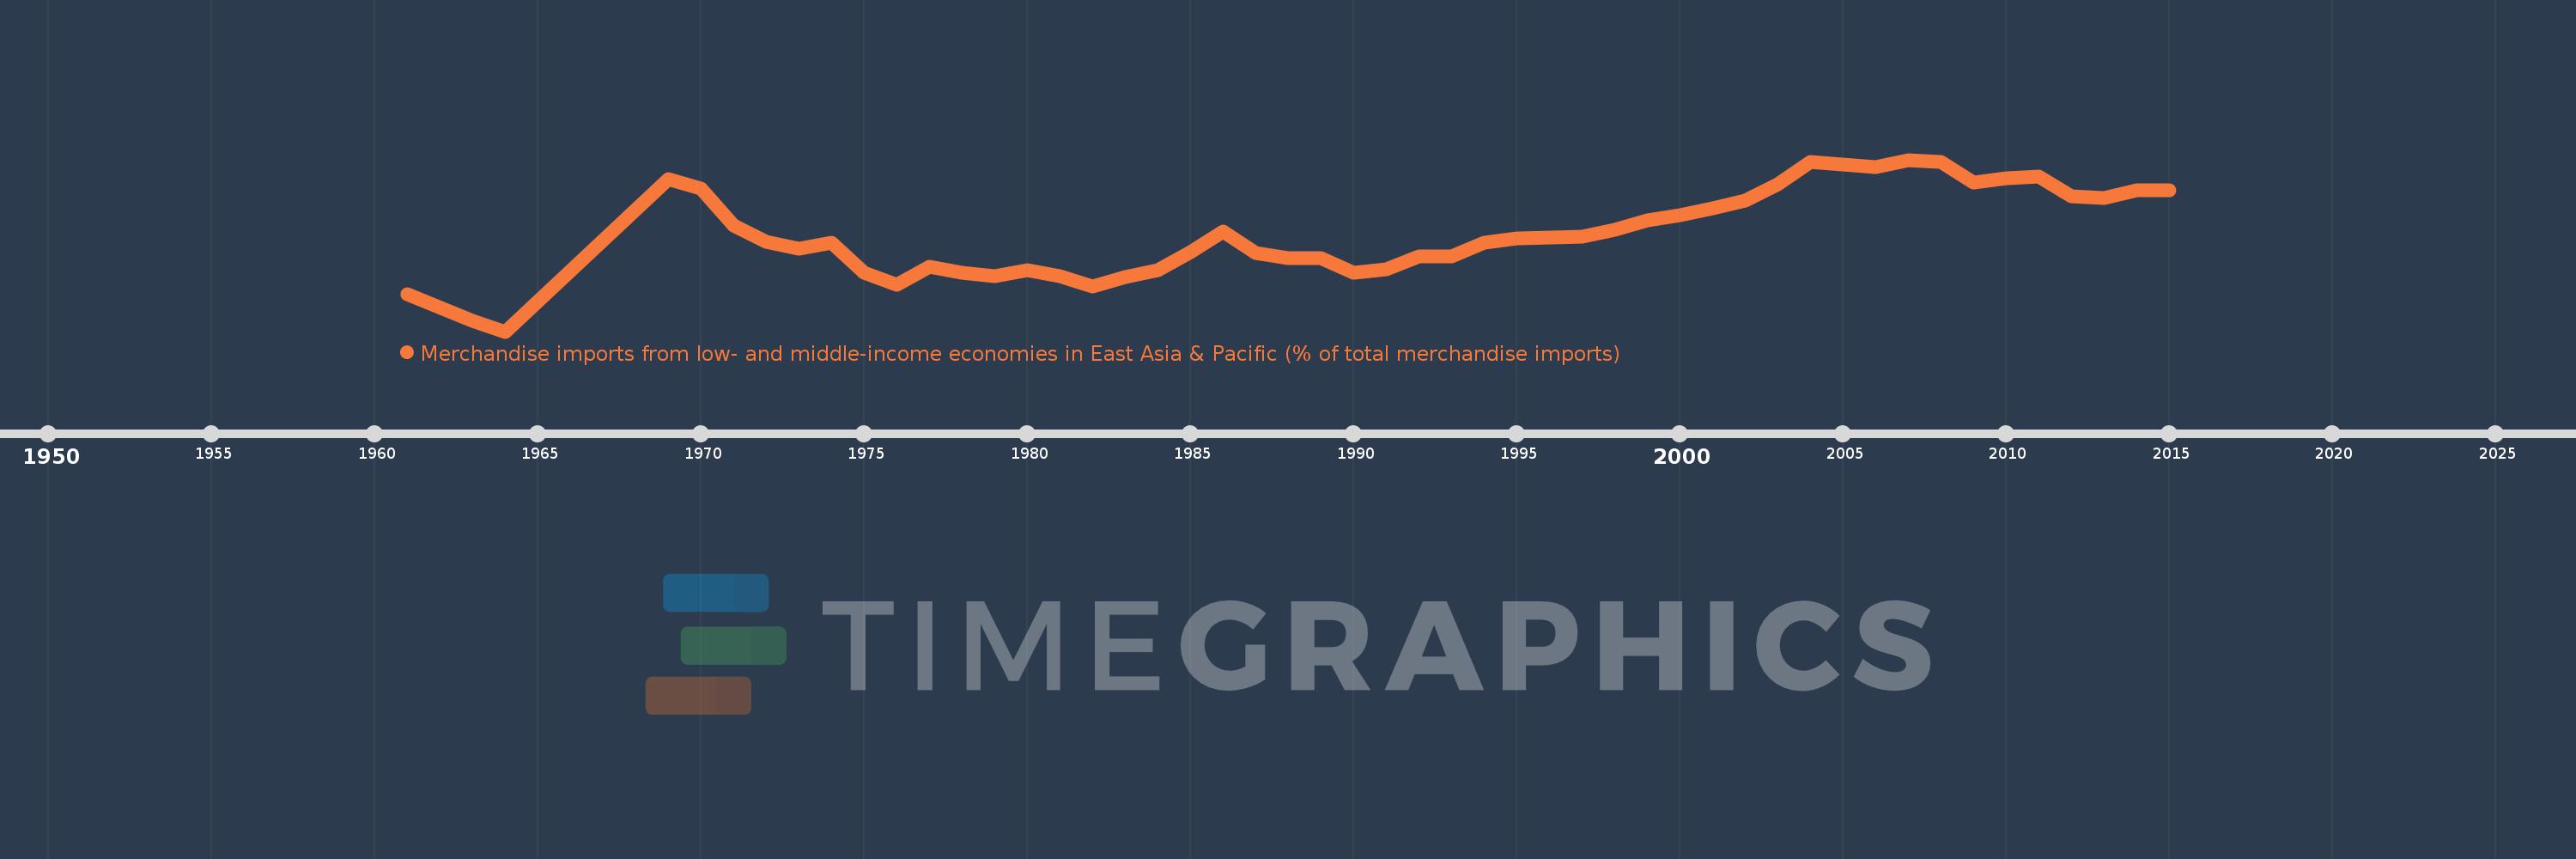
Merchandise imports from low- and middle-income economies in East Asia & Pacific (% of total merchandise imports)
2015,2014,2013,2012,2011,2010,2009,2008,2007,2006,2005,2004,2003,2002,2001,2000,1999,1998,1997,1996,1995,1994,1993,1992,1991,1990,1989,1988,1987,1986,1985,1984,1983,1982,1981,1980,1979,1978,1977,1976,1975,1974,1973,1972,1971,1970,1969,1964,1963,1961
This statistics in other country:
AfghanistanAlbaniaAlgeriaArab WorldArgentinaArmeniaArubaAustraliaAustriaAzerbaijanBahamas, TheBahrainBangladeshBarbadosBelarusBelgiumBelizeBeninBermudaBoliviaBrazilBrunei DarussalamBulgariaBurkina FasoBurundiCabo VerdeCambodiaCameroonCanadaCaribbean small statesCentral African RepublicCentral Europe and the BalticsChileChinaColombiaCongo, Rep.Costa RicaCote d'IvoireCroatiaCyprusCzech RepublicDenmarkDominicaDominican RepublicEarly-demographic dividendEast Asia & PacificEast Asia & Pacific (excluding high income)East Asia & Pacific (IDA & IBRD countries)EcuadorEgypt, Arab Rep.El SalvadorEstoniaEthiopiaEuro areaEurope & Central AsiaEurope & Central Asia (excluding high income)Europe & Central Asia (IDA & IBRD countries)European UnionFijiFinlandFragile and conflict affected situationsFranceFrench PolynesiaGabonGambia, TheGeorgiaGermanyGhanaGreeceGreenlandGrenadaGuatemalaHaitiHeavily indebted poor countries (HIPC)High incomeHondurasHong Kong SAR, ChinaHungaryIBRD onlyIcelandIDA & IBRD totalIDA blendIDA onlyIDA totalIndiaIndonesiaIran, Islamic Rep.IraqIrelandIsraelItalyJamaicaJapanJordanKazakhstanKenyaKorea, Dem. People’s Rep.Korea, Rep.KuwaitKyrgyz RepublicLao PDRLate-demographic dividendLatin America & Caribbean Latin America & Caribbean (excluding high income)Latin America & the Caribbean (IDA & IBRD countries)LatviaLeast developed countries: UN classificationLebanonLithuaniaLow & middle incomeLow incomeLower middle incomeLuxembourgMacao SAR, ChinaMacedonia, FYRMadagascarMalaysiaMaliMaltaMauritiusMexicoMiddle East & North AfricaMiddle East & North Africa (excluding high income)Middle East & North Africa (IDA & IBRD countries)Middle incomeMoldovaMongoliaMontenegroMoroccoMyanmarNetherlandsNew CaledoniaNew ZealandNicaraguaNigerNigeriaNorth AmericaNorwayOECD membersOmanOther small statesPacific island small statesPakistanPanamaPapua New GuineaParaguayPeruPhilippinesPolandPortugalPost-demographic dividendPre-demographic dividendQatarRomaniaRussian FederationSamoaSaudi ArabiaSenegalSerbiaSingaporeSlovak RepublicSloveniaSmall statesSolomon IslandsSomaliaSouth AfricaSouth AsiaSouth Asia (IDA & IBRD)SpainSri LankaSt. Kitts and NevisSt. LuciaSt. Vincent and the GrenadinesSub-Saharan Africa Sub-Saharan Africa (excluding high income)Sub-Saharan Africa (IDA & IBRD countries)SurinameSwedenSwitzerlandTanzaniaThailandTogoTongaTrinidad and TobagoTunisiaTurkeyUgandaUkraineUnited Arab EmiratesUnited KingdomUnited StatesUpper middle incomeUruguayVanuatuVenezuela, RBVietnamWorldYemen, Rep.ZambiaZimbabwe Timeline:
This timeline shows a graph from 1961 to 2015 of Singapore. No data until 1960. Number of actual observations by date: 50.
Source name:
World Development Indicators
Source organization:
World Bank staff estimates based data from International Monetary Fund's Direction of Trade database.
Categories, topics:
Private Sector, Trade
Last updated:
apr 23, 2017
Indicators value changes by year
Minimum:
10.675
jan 1, 1964
Maximum:
37.439
jan 1, 2007
At the date of observation
Value
Absolute change
Change from previous value
jan 1, 1961
16.508
+16.508
0.0%
jan 1, 1963
12.326
-4.181
-25.33%
jan 1, 1964
10.675
-1.651
-13.39%
jan 1, 1969
34.454
+23.778
222.74%
jan 1, 1970
32.923
-1.53
-4.44%
jan 1, 1971
27.157
-5.766
-17.51%
jan 1, 1972
24.663
-2.493
-9.18%
jan 1, 1973
23.653
-1.011
-4.1%
jan 1, 1974
24.51
+0.858
3.63%
jan 1, 1975
19.815
-4.695
-19.16%
jan 1, 1976
18.004
-1.811
-9.14%
jan 1, 1977
20.73
+2.727
15.14%
jan 1, 1978
19.841
-0.889
-4.29%
jan 1, 1979
19.261
-0.58
-2.92%
jan 1, 1980
20.213
+0.952
4.94%
jan 1, 1981
19.241
-0.973
-4.81%
jan 1, 1982
17.67
-1.571
-8.17%
jan 1, 1983
19.152
+1.483
8.39%
jan 1, 1984
20.193
+1.041
5.43%
jan 1, 1985
23.077
+2.883
14.28%
jan 1, 1986
26.296
+3.22
13.95%
jan 1, 1987
22.915
-3.382
-12.86%
jan 1, 1988
22.098
-0.817
-3.57%
jan 1, 1989
22.059
-0.038
-0.17%
jan 1, 1990
19.808
-2.251
-10.2%
jan 1, 1991
20.371
+0.563
2.84%
jan 1, 1992
22.413
+2.042
10.02%
jan 1, 1993
22.37
-0.043
-0.19%
jan 1, 1994
24.58
+2.21
9.88%
jan 1, 1995
25.261
+0.681
2.77%
jan 1, 1996
25.37
+0.109
0.43%
jan 1, 1997
25.489
+0.119
0.47%
jan 1, 1998
26.574
+1.085
4.26%
jan 1, 1999
27.977
+1.403
5.28%
jan 1, 2000
28.755
+0.777
2.78%
jan 1, 2001
29.827
+1.073
3.73%
jan 1, 2002
31.071
+1.243
4.17%
jan 1, 2003
33.616
+2.545
8.19%
jan 1, 2004
37.081
+3.465
10.31%
jan 1, 2005
36.68
-0.401
-1.08%
jan 1, 2006
36.25
-0.429
-1.17%
jan 1, 2007
37.439
+1.189
3.28%
jan 1, 2008
37.064
-0.375
-1.0%
jan 1, 2009
33.874
-3.19
-8.61%
jan 1, 2010
34.571
+0.698
2.06%
jan 1, 2011
34.81
+0.238
0.69%
jan 1, 2012
31.718
-3.092
-8.88%
jan 1, 2013
31.43
-0.288
-0.91%
jan 1, 2014
32.634
+1.205
3.83%
jan 1, 2015
32.662
+0.028
0.09%
Ranking of countries by current statistics by years


Comments: