29
/
en
AIzaSyAYiBZKx7MnpbEhh9jyipgxe19OcubqV5w
April 1, 2024
52055
North America
NAC
false
2
1
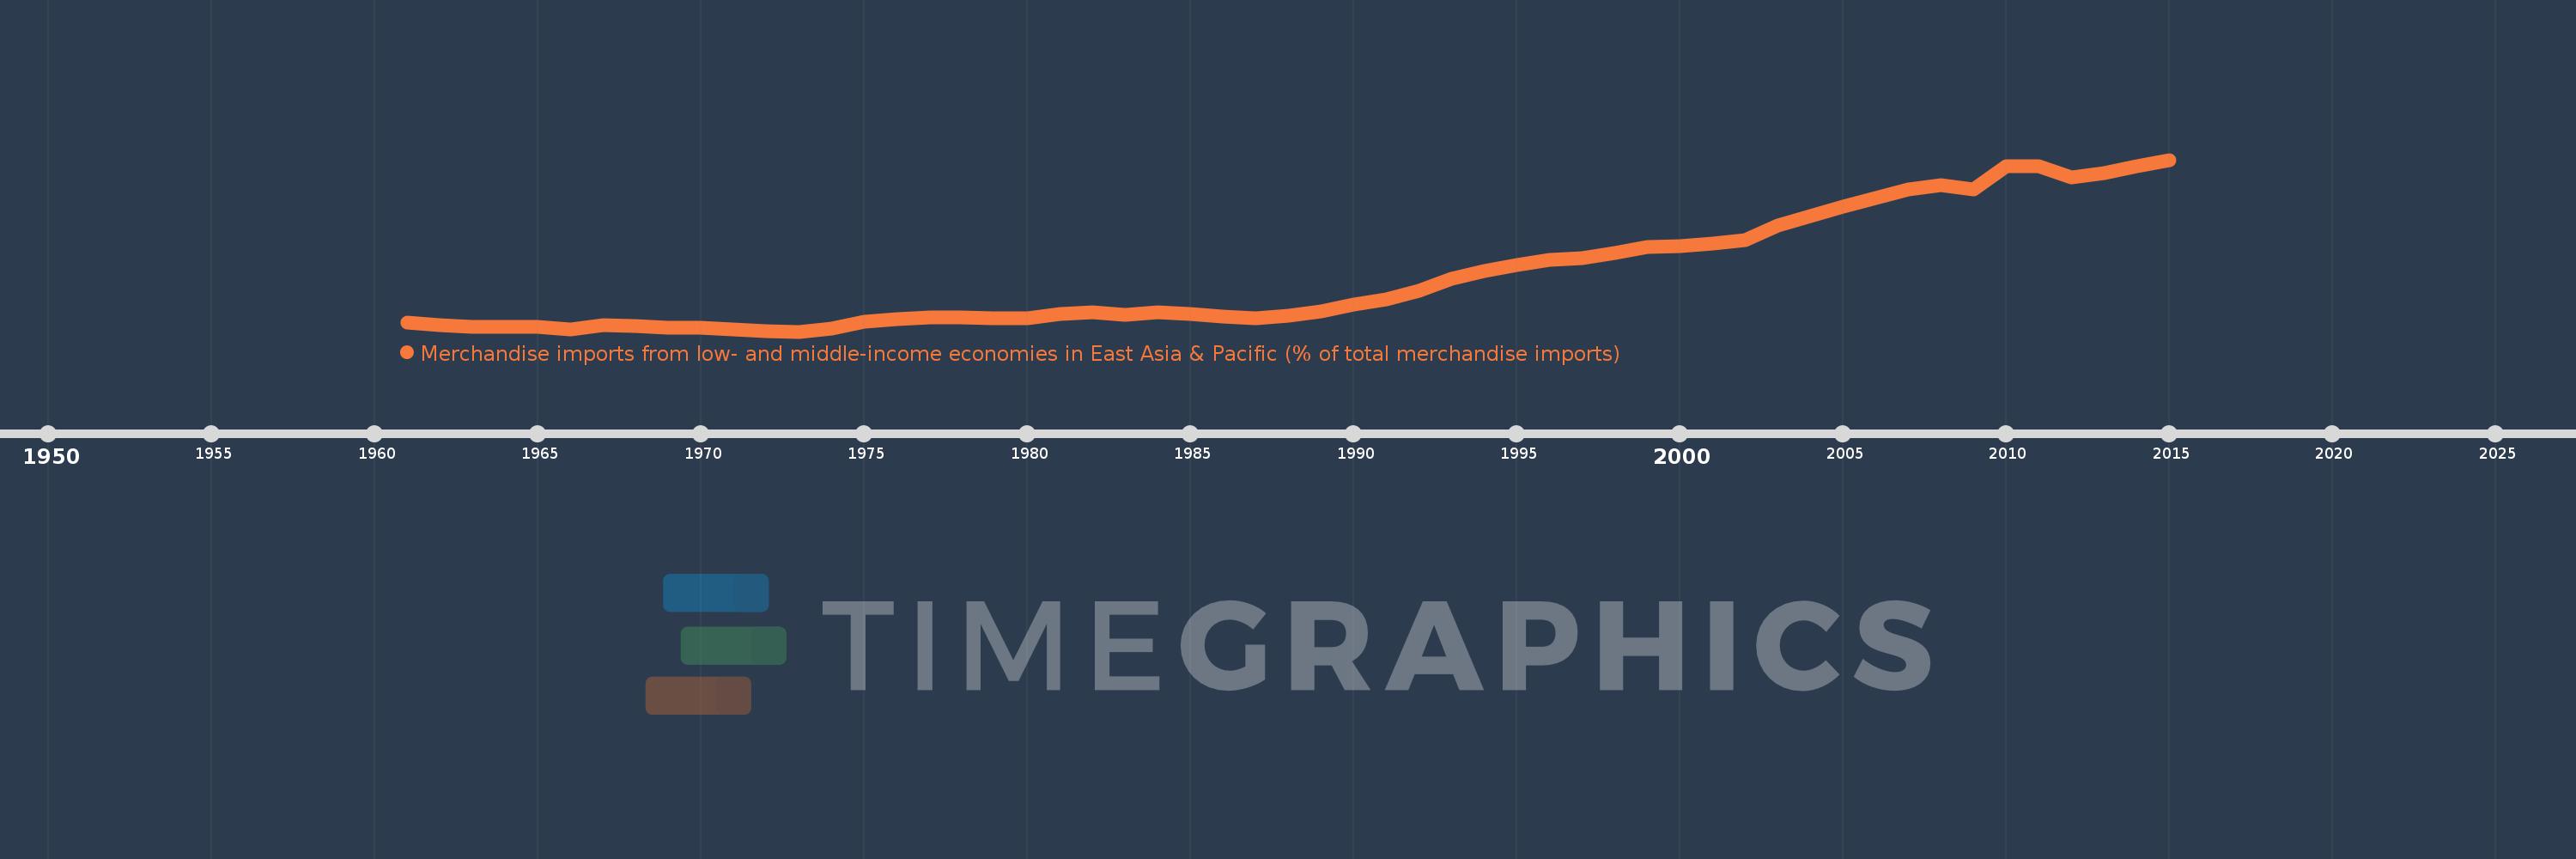
Merchandise imports from low- and middle-income economies in East Asia & Pacific (% of total merchandise imports)
2015,2014,2013,2012,2011,2010,2009,2008,2007,2006,2005,2004,2003,2002,2001,2000,1999,1998,1997,1996,1995,1994,1993,1992,1991,1990,1989,1988,1987,1986,1985,1984,1983,1982,1981,1980,1979,1978,1977,1976,1975,1974,1973,1972,1971,1970,1969,1968,1967,1966,1965,1964,1963,1962,1961
This statistics in other country:
AfghanistanAlbaniaAlgeriaArab WorldArgentinaArmeniaArubaAustraliaAustriaAzerbaijanBahamas, TheBahrainBangladeshBarbadosBelarusBelgiumBelizeBeninBermudaBoliviaBrazilBrunei DarussalamBulgariaBurkina FasoBurundiCabo VerdeCambodiaCameroonCanadaCaribbean small statesCentral African RepublicCentral Europe and the BalticsChileChinaColombiaCongo, Rep.Costa RicaCote d'IvoireCroatiaCyprusCzech RepublicDenmarkDominicaDominican RepublicEarly-demographic dividendEast Asia & PacificEast Asia & Pacific (excluding high income)East Asia & Pacific (IDA & IBRD countries)EcuadorEgypt, Arab Rep.El SalvadorEstoniaEthiopiaEuro areaEurope & Central AsiaEurope & Central Asia (excluding high income)Europe & Central Asia (IDA & IBRD countries)European UnionFijiFinlandFragile and conflict affected situationsFranceFrench PolynesiaGabonGambia, TheGeorgiaGermanyGhanaGreeceGreenlandGrenadaGuatemalaHaitiHeavily indebted poor countries (HIPC)High incomeHondurasHong Kong SAR, ChinaHungaryIBRD onlyIcelandIDA & IBRD totalIDA blendIDA onlyIDA totalIndiaIndonesiaIran, Islamic Rep.IraqIrelandIsraelItalyJamaicaJapanJordanKazakhstanKenyaKorea, Dem. People’s Rep.Korea, Rep.KuwaitKyrgyz RepublicLao PDRLate-demographic dividendLatin America & Caribbean Latin America & Caribbean (excluding high income)Latin America & the Caribbean (IDA & IBRD countries)LatviaLeast developed countries: UN classificationLebanonLithuaniaLow & middle incomeLow incomeLower middle incomeLuxembourgMacao SAR, ChinaMacedonia, FYRMadagascarMalaysiaMaliMaltaMauritiusMexicoMiddle East & North AfricaMiddle East & North Africa (excluding high income)Middle East & North Africa (IDA & IBRD countries)Middle incomeMoldovaMongoliaMontenegroMoroccoMyanmarNetherlandsNew CaledoniaNew ZealandNicaraguaNigerNigeriaNorth AmericaNorwayOECD membersOmanOther small statesPacific island small statesPakistanPanamaPapua New GuineaParaguayPeruPhilippinesPolandPortugalPost-demographic dividendPre-demographic dividendQatarRomaniaRussian FederationSamoaSaudi ArabiaSenegalSerbiaSingaporeSlovak RepublicSloveniaSmall statesSolomon IslandsSomaliaSouth AfricaSouth AsiaSouth Asia (IDA & IBRD)SpainSri LankaSt. Kitts and NevisSt. LuciaSt. Vincent and the GrenadinesSub-Saharan Africa Sub-Saharan Africa (excluding high income)Sub-Saharan Africa (IDA & IBRD countries)SurinameSwedenSwitzerlandTanzaniaThailandTogoTongaTrinidad and TobagoTunisiaTurkeyUgandaUkraineUnited Arab EmiratesUnited KingdomUnited StatesUpper middle incomeUruguayVanuatuVenezuela, RBVietnamWorldYemen, Rep.ZambiaZimbabwe Timeline:
This timeline shows a graph from 1961 to 2015 of North America. No data until 1960. Number of actual observations by date: 55.
Source name:
World Development Indicators
Source organization:
World Bank staff estimates based data from International Monetary Fund's Direction of Trade database.
Categories, topics:
Private Sector, Trade
Last updated:
apr 23, 2017
Indicators value changes by year
Maximum:
23.012
jan 1, 2015
At the date of observation
Value
Absolute change
Change from previous value
jan 1, 1961
2.914
+2.914
0.0%
jan 1, 1962
2.601
-0.313
-10.74%
jan 1, 1963
2.319
-0.282
-10.84%
jan 1, 1964
2.308
-0.011
-0.49%
jan 1, 1965
2.392
+0.085
3.66%
jan 1, 1966
2.067
-0.325
-13.57%
jan 1, 1967
2.562
+0.495
23.94%
jan 1, 1968
2.451
-0.111
-4.33%
jan 1, 1969
2.199
-0.252
-10.28%
jan 1, 1970
2.207
+0.008
0.35%
jan 1, 1971
2.037
-0.17
-7.72%
jan 1, 1972
1.862
-0.174
-8.56%
jan 1, 1973
1.768
-0.094
-5.06%
jan 1, 1974
2.102
+0.334
18.89%
jan 1, 1975
2.975
+0.873
41.52%
jan 1, 1976
3.329
+0.355
11.93%
jan 1, 1977
3.483
+0.154
4.62%
jan 1, 1978
3.539
+0.055
1.59%
jan 1, 1979
3.402
-0.137
-3.86%
jan 1, 1980
3.397
-0.004
-0.13%
jan 1, 1981
3.895
+0.498
14.65%
jan 1, 1982
4.15
+0.255
6.55%
jan 1, 1983
3.879
-0.271
-6.53%
jan 1, 1984
4.144
+0.264
6.81%
jan 1, 1985
3.966
-0.178
-4.29%
jan 1, 1986
3.621
-0.345
-8.7%
jan 1, 1987
3.425
-0.196
-5.42%
jan 1, 1988
3.777
+0.353
10.3%
jan 1, 1989
4.263
+0.486
12.87%
jan 1, 1990
5.125
+0.861
20.2%
jan 1, 1991
5.735
+0.61
11.91%
jan 1, 1992
6.791
+1.056
18.4%
jan 1, 1993
8.32
+1.53
22.53%
jan 1, 1994
9.248
+0.928
11.15%
jan 1, 1995
10.0
+0.752
8.13%
jan 1, 1996
10.608
+0.608
6.08%
jan 1, 1997
10.901
+0.293
2.76%
jan 1, 1998
11.452
+0.551
5.05%
jan 1, 1999
12.19
+0.738
6.44%
jan 1, 2000
12.343
+0.153
1.26%
jan 1, 2001
12.662
+0.319
2.59%
jan 1, 2002
13.089
+0.426
3.37%
jan 1, 2003
14.87
+1.781
13.61%
jan 1, 2004
16.088
+1.217
8.19%
jan 1, 2005
17.173
+1.086
6.75%
jan 1, 2006
18.334
+1.161
6.76%
jan 1, 2007
19.298
+0.964
5.26%
jan 1, 2008
19.881
+0.583
3.02%
jan 1, 2009
19.394
-0.486
-2.45%
jan 1, 2010
22.226
+2.832
14.6%
jan 1, 2011
22.245
+0.019
0.08%
jan 1, 2012
20.785
-1.46
-6.56%
jan 1, 2013
21.345
+0.56
2.7%
jan 1, 2014
22.209
+0.864
4.05%
jan 1, 2015
23.012
+0.803
3.62%
Ranking of countries by current statistics by years


Comments: