29
/
en
AIzaSyAYiBZKx7MnpbEhh9jyipgxe19OcubqV5w
April 1, 2024
190515
Mali
MLI
true
2
1
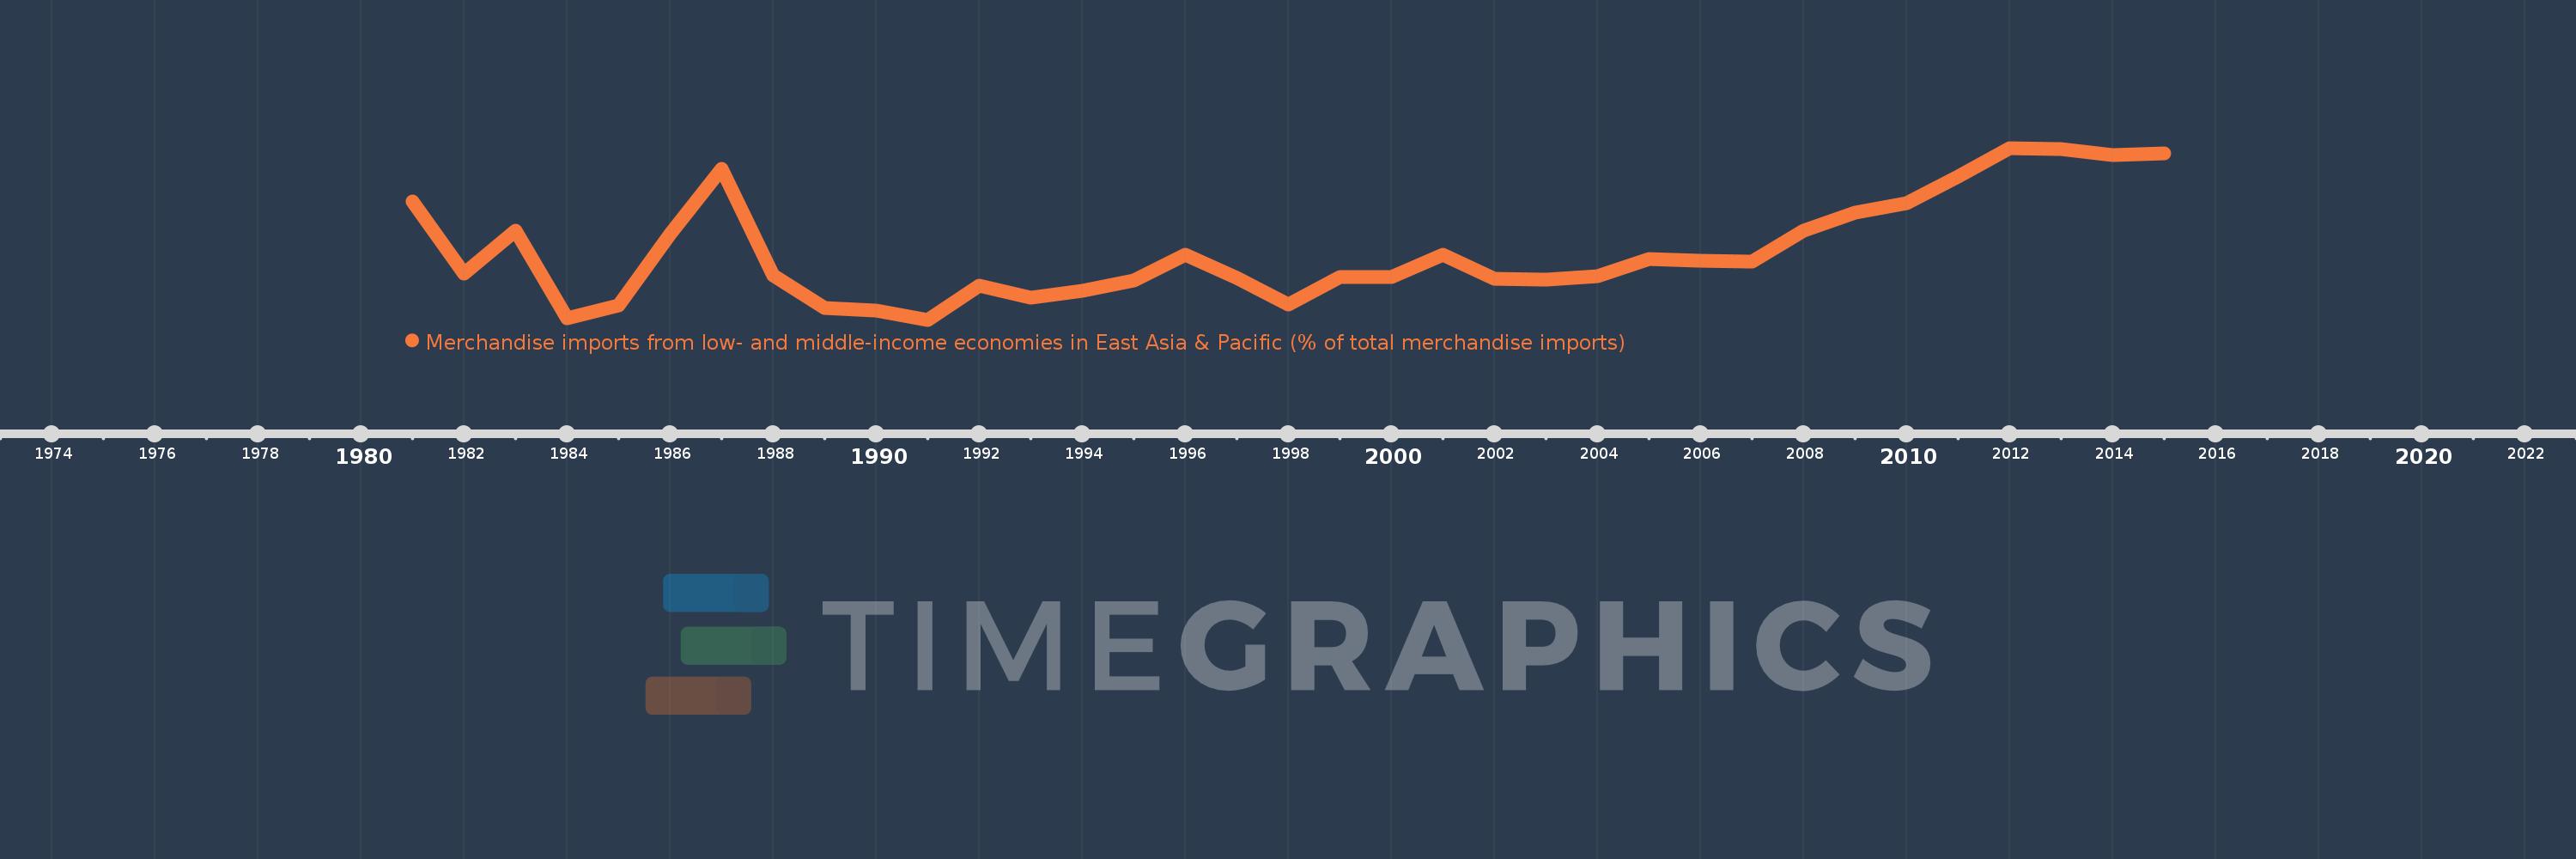
Merchandise imports from low- and middle-income economies in East Asia & Pacific (% of total merchandise imports)
2015,2014,2013,2012,2011,2010,2009,2008,2007,2006,2005,2004,2003,2002,2001,2000,1999,1998,1997,1996,1995,1994,1993,1992,1991,1990,1989,1988,1987,1986,1985,1984,1983,1982,1981
Global statistics library →Mali →Merchandise imports from low- and middle-income economies in East Asia & Pacific (% of total merchandise imports)
This statistics in other country:
AfghanistanAlbaniaAlgeriaArab WorldArgentinaArmeniaArubaAustraliaAustriaAzerbaijanBahamas, TheBahrainBangladeshBarbadosBelarusBelgiumBelizeBeninBermudaBoliviaBrazilBrunei DarussalamBulgariaBurkina FasoBurundiCabo VerdeCambodiaCameroonCanadaCaribbean small statesCentral African RepublicCentral Europe and the BalticsChileChinaColombiaCongo, Rep.Costa RicaCote d'IvoireCroatiaCyprusCzech RepublicDenmarkDominicaDominican RepublicEarly-demographic dividendEast Asia & PacificEast Asia & Pacific (excluding high income)East Asia & Pacific (IDA & IBRD countries)EcuadorEgypt, Arab Rep.El SalvadorEstoniaEthiopiaEuro areaEurope & Central AsiaEurope & Central Asia (excluding high income)Europe & Central Asia (IDA & IBRD countries)European UnionFijiFinlandFragile and conflict affected situationsFranceFrench PolynesiaGabonGambia, TheGeorgiaGermanyGhanaGreeceGreenlandGrenadaGuatemalaHaitiHeavily indebted poor countries (HIPC)High incomeHondurasHong Kong SAR, ChinaHungaryIBRD onlyIcelandIDA & IBRD totalIDA blendIDA onlyIDA totalIndiaIndonesiaIran, Islamic Rep.IraqIrelandIsraelItalyJamaicaJapanJordanKazakhstanKenyaKorea, Dem. People’s Rep.Korea, Rep.KuwaitKyrgyz RepublicLao PDRLate-demographic dividendLatin America & Caribbean Latin America & Caribbean (excluding high income)Latin America & the Caribbean (IDA & IBRD countries)LatviaLeast developed countries: UN classificationLebanonLithuaniaLow & middle incomeLow incomeLower middle incomeLuxembourgMacao SAR, ChinaMacedonia, FYRMadagascarMalaysiaMaliMaltaMauritiusMexicoMiddle East & North AfricaMiddle East & North Africa (excluding high income)Middle East & North Africa (IDA & IBRD countries)Middle incomeMoldovaMongoliaMontenegroMoroccoMyanmarNetherlandsNew CaledoniaNew ZealandNicaraguaNigerNigeriaNorth AmericaNorwayOECD membersOmanOther small statesPacific island small statesPakistanPanamaPapua New GuineaParaguayPeruPhilippinesPolandPortugalPost-demographic dividendPre-demographic dividendQatarRomaniaRussian FederationSamoaSaudi ArabiaSenegalSerbiaSingaporeSlovak RepublicSloveniaSmall statesSolomon IslandsSomaliaSouth AfricaSouth AsiaSouth Asia (IDA & IBRD)SpainSri LankaSt. Kitts and NevisSt. LuciaSt. Vincent and the GrenadinesSub-Saharan Africa Sub-Saharan Africa (excluding high income)Sub-Saharan Africa (IDA & IBRD countries)SurinameSwedenSwitzerlandTanzaniaThailandTogoTongaTrinidad and TobagoTunisiaTurkeyUgandaUkraineUnited Arab EmiratesUnited KingdomUnited StatesUpper middle incomeUruguayVanuatuVenezuela, RBVietnamWorldYemen, Rep.ZambiaZimbabwe Timeline:
This timeline shows a graph from 1981 to 2015 of Mali. No data until 1980. Number of actual observations by date: 35.
Source name:
World Development Indicators
Source organization:
World Bank staff estimates based data from International Monetary Fund's Direction of Trade database.
Categories, topics:
Private Sector, Trade
Last updated:
apr 23, 2017
Indicators value changes by year
At the date of observation
Value
Absolute change
Change from previous value
jan 1, 1981
6.59
+6.59
0.0%
jan 1, 1982
3.294
-3.296
-50.01%
jan 1, 1983
5.244
+1.949
59.18%
jan 1, 1984
1.221
-4.022
-76.71%
jan 1, 1985
1.82
+0.599
49.01%
jan 1, 1986
5.088
+3.268
179.57%
jan 1, 1987
8.08
+2.992
58.8%
jan 1, 1988
3.193
-4.887
-60.48%
jan 1, 1989
1.715
-1.479
-46.3%
jan 1, 1990
1.577
-0.138
-8.04%
jan 1, 1991
1.171
-0.406
-25.72%
jan 1, 1992
2.72
+1.548
132.21%
jan 1, 1993
2.194
-0.526
-19.33%
jan 1, 1994
2.488
+0.294
13.41%
jan 1, 1995
2.98
+0.492
19.76%
jan 1, 1996
4.136
+1.156
38.78%
jan 1, 1997
3.087
-1.048
-25.35%
jan 1, 1998
1.86
-1.227
-39.74%
jan 1, 1999
3.116
+1.256
67.51%
jan 1, 2000
3.118
+0.002
0.06%
jan 1, 2001
4.151
+1.033
33.14%
jan 1, 2002
3.063
-1.088
-26.21%
jan 1, 2003
3.002
-0.061
-2.01%
jan 1, 2004
3.161
+0.159
5.3%
jan 1, 2005
3.949
+0.788
24.95%
jan 1, 2006
3.88
-0.069
-1.76%
jan 1, 2007
3.819
-0.061
-1.57%
jan 1, 2008
5.244
+1.425
37.32%
jan 1, 2009
6.073
+0.828
15.79%
jan 1, 2010
6.507
+0.434
7.15%
jan 1, 2011
7.722
+1.215
18.68%
jan 1, 2012
9.034
+1.313
17.0%
jan 1, 2013
8.97
-0.065
-0.72%
jan 1, 2014
8.696
-0.273
-3.05%
jan 1, 2015
8.797
+0.1
1.15%
Ranking of countries by current statistics by years


Comments: