29
/
en
AIzaSyAYiBZKx7MnpbEhh9jyipgxe19OcubqV5w
April 1, 2024
286175
Zambia
ZMB
true
2
1
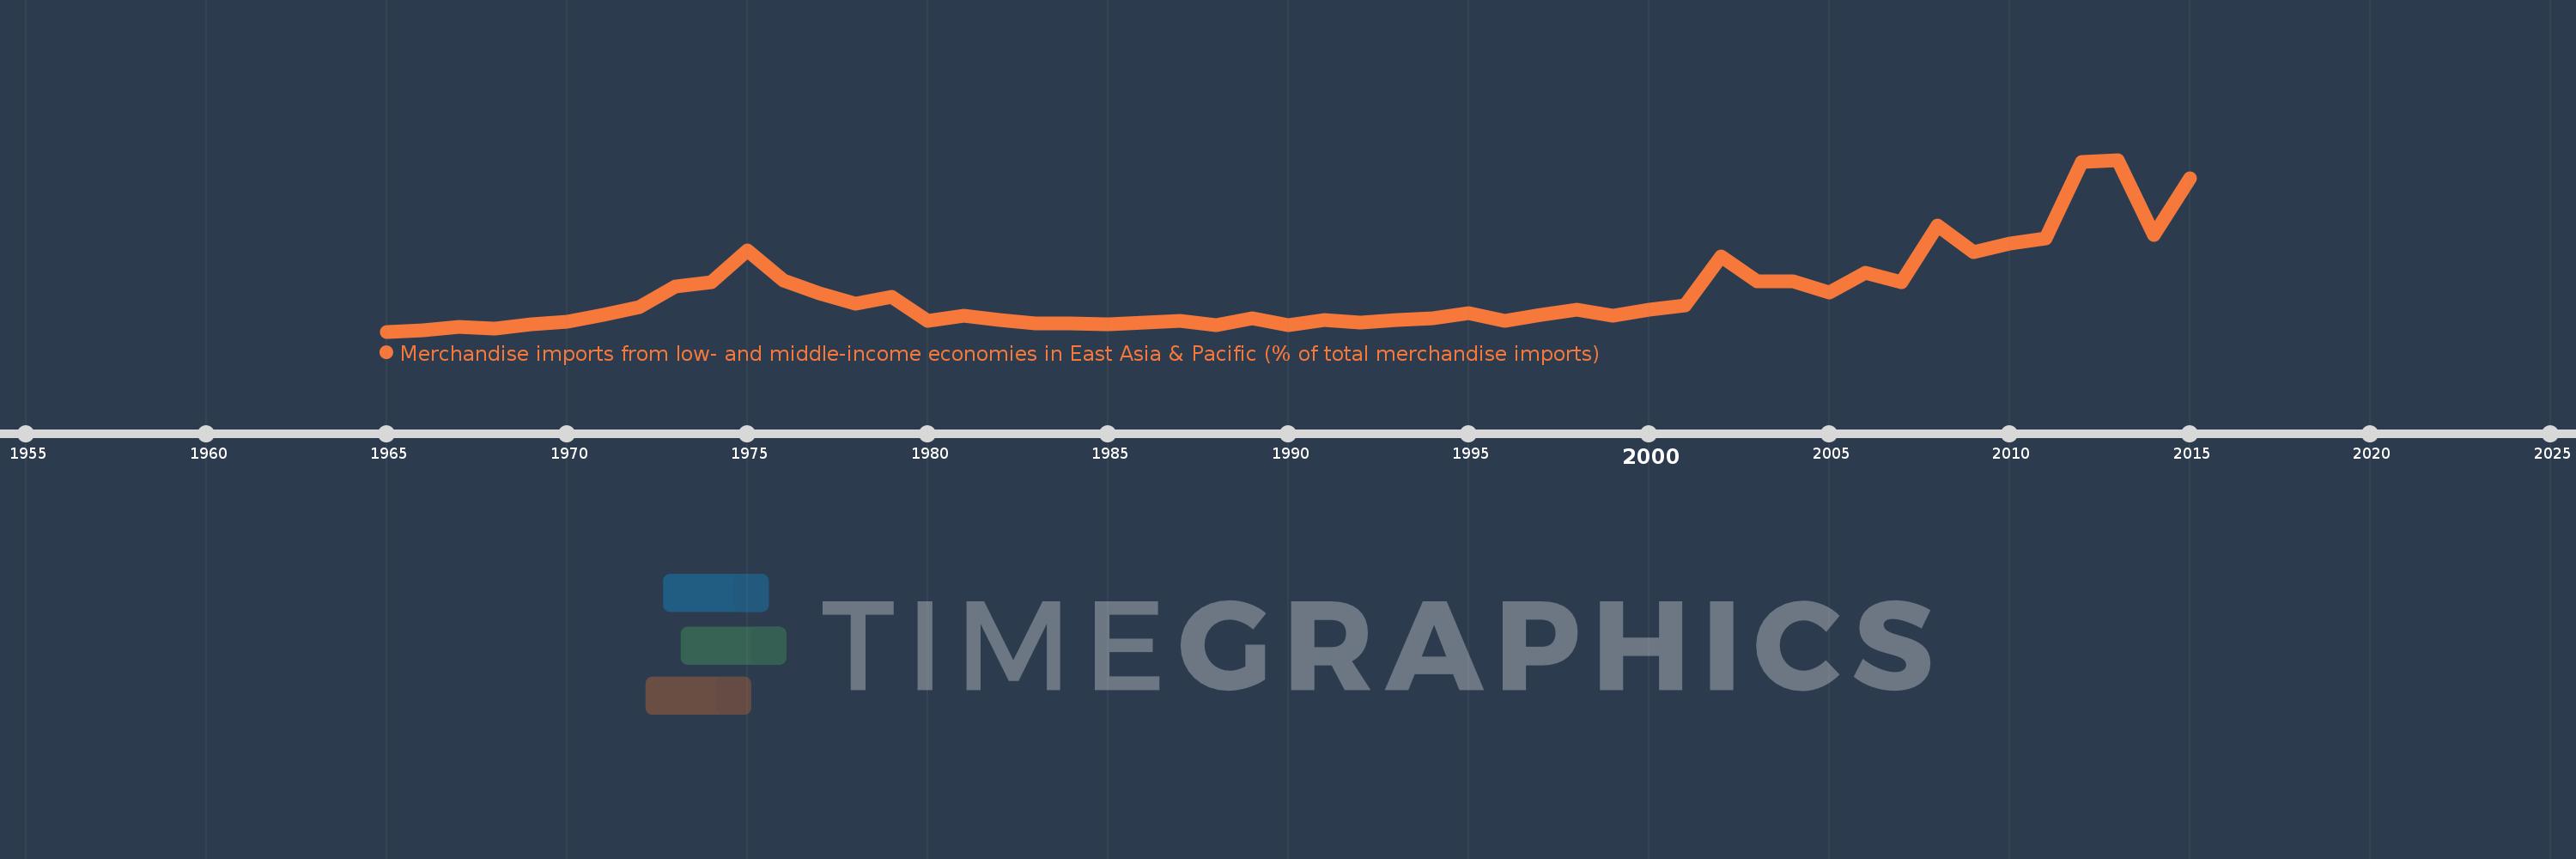
Merchandise imports from low- and middle-income economies in East Asia & Pacific (% of total merchandise imports)
2015,2014,2013,2012,2011,2010,2009,2008,2007,2006,2005,2004,2003,2002,2001,2000,1999,1998,1997,1996,1995,1994,1993,1992,1991,1990,1989,1988,1987,1986,1985,1984,1983,1982,1981,1980,1979,1978,1977,1976,1975,1974,1973,1972,1971,1970,1969,1968,1967,1966,1965
This statistics in other country:
AfghanistanAlbaniaAlgeriaArab WorldArgentinaArmeniaArubaAustraliaAustriaAzerbaijanBahamas, TheBahrainBangladeshBarbadosBelarusBelgiumBelizeBeninBermudaBoliviaBrazilBrunei DarussalamBulgariaBurkina FasoBurundiCabo VerdeCambodiaCameroonCanadaCaribbean small statesCentral African RepublicCentral Europe and the BalticsChileChinaColombiaCongo, Rep.Costa RicaCote d'IvoireCroatiaCyprusCzech RepublicDenmarkDominicaDominican RepublicEarly-demographic dividendEast Asia & PacificEast Asia & Pacific (excluding high income)East Asia & Pacific (IDA & IBRD countries)EcuadorEgypt, Arab Rep.El SalvadorEstoniaEthiopiaEuro areaEurope & Central AsiaEurope & Central Asia (excluding high income)Europe & Central Asia (IDA & IBRD countries)European UnionFijiFinlandFragile and conflict affected situationsFranceFrench PolynesiaGabonGambia, TheGeorgiaGermanyGhanaGreeceGreenlandGrenadaGuatemalaHaitiHeavily indebted poor countries (HIPC)High incomeHondurasHong Kong SAR, ChinaHungaryIBRD onlyIcelandIDA & IBRD totalIDA blendIDA onlyIDA totalIndiaIndonesiaIran, Islamic Rep.IraqIrelandIsraelItalyJamaicaJapanJordanKazakhstanKenyaKorea, Dem. People’s Rep.Korea, Rep.KuwaitKyrgyz RepublicLao PDRLate-demographic dividendLatin America & Caribbean Latin America & Caribbean (excluding high income)Latin America & the Caribbean (IDA & IBRD countries)LatviaLeast developed countries: UN classificationLebanonLithuaniaLow & middle incomeLow incomeLower middle incomeLuxembourgMacao SAR, ChinaMacedonia, FYRMadagascarMalaysiaMaliMaltaMauritiusMexicoMiddle East & North AfricaMiddle East & North Africa (excluding high income)Middle East & North Africa (IDA & IBRD countries)Middle incomeMoldovaMongoliaMontenegroMoroccoMyanmarNetherlandsNew CaledoniaNew ZealandNicaraguaNigerNigeriaNorth AmericaNorwayOECD membersOmanOther small statesPacific island small statesPakistanPanamaPapua New GuineaParaguayPeruPhilippinesPolandPortugalPost-demographic dividendPre-demographic dividendQatarRomaniaRussian FederationSamoaSaudi ArabiaSenegalSerbiaSingaporeSlovak RepublicSloveniaSmall statesSolomon IslandsSomaliaSouth AfricaSouth AsiaSouth Asia (IDA & IBRD)SpainSri LankaSt. Kitts and NevisSt. LuciaSt. Vincent and the GrenadinesSub-Saharan Africa Sub-Saharan Africa (excluding high income)Sub-Saharan Africa (IDA & IBRD countries)SurinameSwedenSwitzerlandTanzaniaThailandTogoTongaTrinidad and TobagoTunisiaTurkeyUgandaUkraineUnited Arab EmiratesUnited KingdomUnited StatesUpper middle incomeUruguayVanuatuVenezuela, RBVietnamWorldYemen, Rep.ZambiaZimbabwe Timeline:
This timeline shows a graph from 1965 to 2015 of Zambia. No data until 1964. Number of actual observations by date: 51.
Source name:
World Development Indicators
Source organization:
World Bank staff estimates based data from International Monetary Fund's Direction of Trade database.
Categories, topics:
Private Sector, Trade
Last updated:
apr 23, 2017
Indicators value changes by year
Maximum:
10.698
jan 1, 2013
At the date of observation
Value
Absolute change
Change from previous value
jan 1, 1965
0.021
+0.021
0.0%
jan 1, 1966
0.102
+0.082
398.1%
jan 1, 1967
0.321
+0.219
214.13%
jan 1, 1968
0.202
-0.119
-37.09%
jan 1, 1969
0.458
+0.256
126.99%
jan 1, 1970
0.649
+0.19
41.49%
jan 1, 1971
1.036
+0.388
59.75%
jan 1, 1972
1.518
+0.482
46.55%
jan 1, 1973
2.819
+1.3
85.65%
jan 1, 1974
3.086
+0.267
9.48%
jan 1, 1975
5.07
+1.984
64.27%
jan 1, 1976
3.182
-1.888
-37.24%
jan 1, 1977
2.416
-0.766
-24.07%
jan 1, 1978
1.775
-0.641
-26.54%
jan 1, 1979
2.206
+0.431
24.27%
jan 1, 1980
0.715
-1.49
-67.57%
jan 1, 1981
0.989
+0.274
38.25%
jan 1, 1982
0.732
-0.257
-25.98%
jan 1, 1983
0.529
-0.203
-27.69%
jan 1, 1984
0.529
0.0
0.0%
jan 1, 1985
0.459
-0.07
-13.28%
jan 1, 1986
0.555
+0.096
20.95%
jan 1, 1987
0.709
+0.154
27.73%
jan 1, 1988
0.432
-0.277
-39.03%
jan 1, 1989
0.874
+0.442
102.26%
jan 1, 1990
0.44
-0.435
-49.72%
jan 1, 1991
0.717
+0.277
63.11%
jan 1, 1992
0.567
-0.15
-20.9%
jan 1, 1993
0.723
+0.155
27.38%
jan 1, 1994
0.858
+0.136
18.81%
jan 1, 1995
1.186
+0.328
38.19%
jan 1, 1996
0.7
-0.486
-40.97%
jan 1, 1997
1.061
+0.361
51.5%
jan 1, 1998
1.368
+0.307
28.9%
jan 1, 1999
0.99
-0.377
-27.58%
jan 1, 2000
1.366
+0.375
37.9%
jan 1, 2001
1.653
+0.288
21.07%
jan 1, 2002
4.715
+3.062
185.16%
jan 1, 2003
3.152
-1.563
-33.15%
jan 1, 2004
3.124
-0.029
-0.91%
jan 1, 2005
2.453
-0.671
-21.48%
jan 1, 2006
3.687
+1.234
50.33%
jan 1, 2007
3.065
-0.622
-16.87%
jan 1, 2008
6.604
+3.539
115.48%
jan 1, 2009
4.973
-1.632
-24.71%
jan 1, 2010
5.477
+0.504
10.14%
jan 1, 2011
5.834
+0.357
6.51%
jan 1, 2012
10.546
+4.712
80.78%
jan 1, 2013
10.698
+0.152
1.44%
jan 1, 2014
6.028
-4.67
-43.65%
jan 1, 2015
9.528
+3.5
58.06%
Ranking of countries by current statistics by years


Comments: