29
/
en
AIzaSyAYiBZKx7MnpbEhh9jyipgxe19OcubqV5w
April 1, 2024
24297
Arab World
ARB
false
2
1
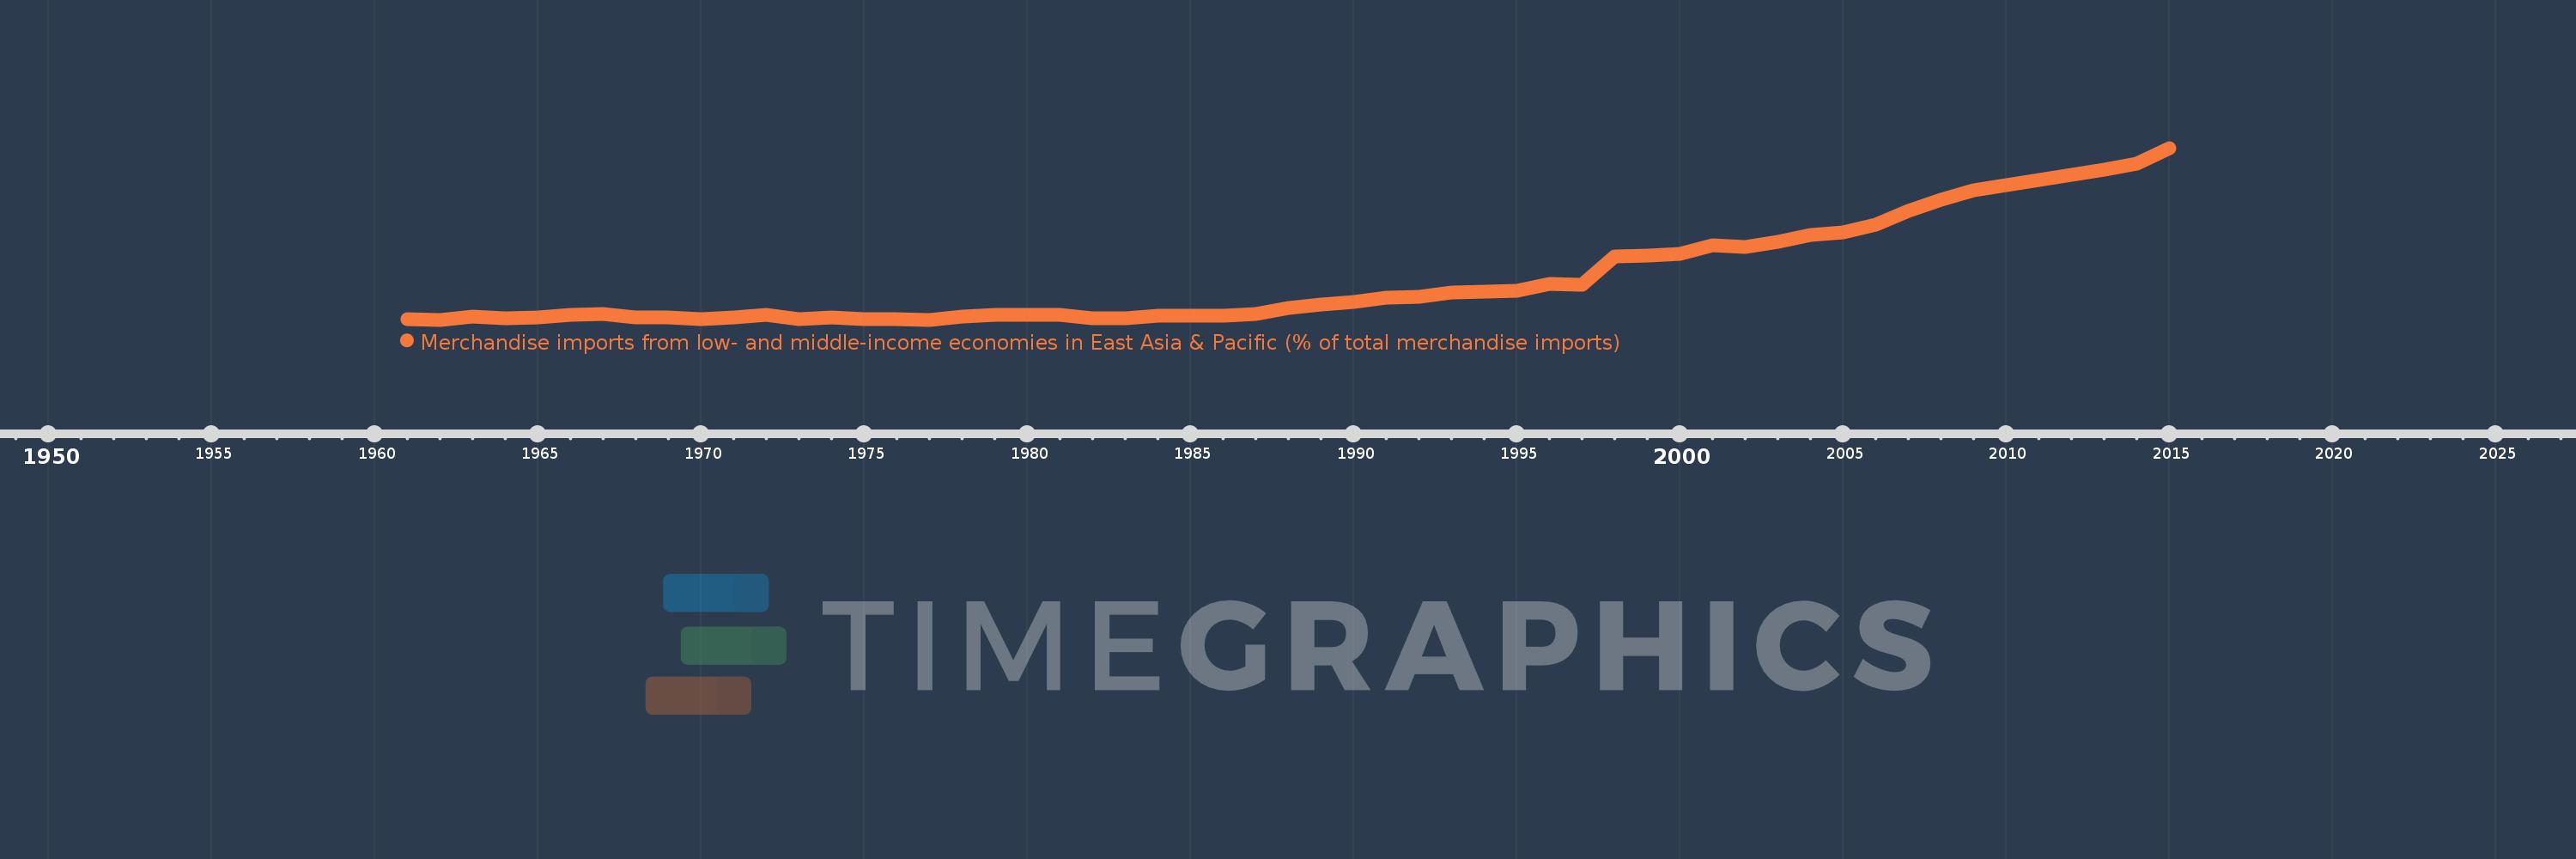
Merchandise imports from low- and middle-income economies in East Asia & Pacific (% of total merchandise imports)
2015,2014,2013,2012,2011,2010,2009,2008,2007,2006,2005,2004,2003,2002,2001,2000,1999,1998,1997,1996,1995,1994,1993,1992,1991,1990,1989,1988,1987,1986,1985,1984,1983,1982,1981,1980,1979,1978,1977,1976,1975,1974,1973,1972,1971,1970,1969,1968,1967,1966,1965,1964,1963,1962,1961
This statistics in other country:
AfghanistanAlbaniaAlgeriaArab WorldArgentinaArmeniaArubaAustraliaAustriaAzerbaijanBahamas, TheBahrainBangladeshBarbadosBelarusBelgiumBelizeBeninBermudaBoliviaBrazilBrunei DarussalamBulgariaBurkina FasoBurundiCabo VerdeCambodiaCameroonCanadaCaribbean small statesCentral African RepublicCentral Europe and the BalticsChileChinaColombiaCongo, Rep.Costa RicaCote d'IvoireCroatiaCyprusCzech RepublicDenmarkDominicaDominican RepublicEarly-demographic dividendEast Asia & PacificEast Asia & Pacific (excluding high income)East Asia & Pacific (IDA & IBRD countries)EcuadorEgypt, Arab Rep.El SalvadorEstoniaEthiopiaEuro areaEurope & Central AsiaEurope & Central Asia (excluding high income)Europe & Central Asia (IDA & IBRD countries)European UnionFijiFinlandFragile and conflict affected situationsFranceFrench PolynesiaGabonGambia, TheGeorgiaGermanyGhanaGreeceGreenlandGrenadaGuatemalaHaitiHeavily indebted poor countries (HIPC)High incomeHondurasHong Kong SAR, ChinaHungaryIBRD onlyIcelandIDA & IBRD totalIDA blendIDA onlyIDA totalIndiaIndonesiaIran, Islamic Rep.IraqIrelandIsraelItalyJamaicaJapanJordanKazakhstanKenyaKorea, Dem. People’s Rep.Korea, Rep.KuwaitKyrgyz RepublicLao PDRLate-demographic dividendLatin America & Caribbean Latin America & Caribbean (excluding high income)Latin America & the Caribbean (IDA & IBRD countries)LatviaLeast developed countries: UN classificationLebanonLithuaniaLow & middle incomeLow incomeLower middle incomeLuxembourgMacao SAR, ChinaMacedonia, FYRMadagascarMalaysiaMaliMaltaMauritiusMexicoMiddle East & North AfricaMiddle East & North Africa (excluding high income)Middle East & North Africa (IDA & IBRD countries)Middle incomeMoldovaMongoliaMontenegroMoroccoMyanmarNetherlandsNew CaledoniaNew ZealandNicaraguaNigerNigeriaNorth AmericaNorwayOECD membersOmanOther small statesPacific island small statesPakistanPanamaPapua New GuineaParaguayPeruPhilippinesPolandPortugalPost-demographic dividendPre-demographic dividendQatarRomaniaRussian FederationSamoaSaudi ArabiaSenegalSerbiaSingaporeSlovak RepublicSloveniaSmall statesSolomon IslandsSomaliaSouth AfricaSouth AsiaSouth Asia (IDA & IBRD)SpainSri LankaSt. Kitts and NevisSt. LuciaSt. Vincent and the GrenadinesSub-Saharan Africa Sub-Saharan Africa (excluding high income)Sub-Saharan Africa (IDA & IBRD countries)SurinameSwedenSwitzerlandTanzaniaThailandTogoTongaTrinidad and TobagoTunisiaTurkeyUgandaUkraineUnited Arab EmiratesUnited KingdomUnited StatesUpper middle incomeUruguayVanuatuVenezuela, RBVietnamWorldYemen, Rep.ZambiaZimbabwe Timeline:
This timeline shows a graph from 1961 to 2015 of Arab World. No data until 1960. Number of actual observations by date: 55.
Source name:
World Development Indicators
Source organization:
World Bank staff estimates based data from International Monetary Fund's Direction of Trade database.
Categories, topics:
Private Sector, Trade
Last updated:
apr 23, 2017
Indicators value changes by year
Maximum:
16.176
jan 1, 2015
At the date of observation
Value
Absolute change
Change from previous value
jan 1, 1961
0.581
+0.581
0.0%
jan 1, 1962
0.543
-0.038
-6.55%
jan 1, 1963
0.796
+0.253
46.56%
jan 1, 1964
0.645
-0.151
-18.92%
jan 1, 1965
0.722
+0.076
11.86%
jan 1, 1966
0.949
+0.228
31.55%
jan 1, 1967
1.06
+0.111
11.72%
jan 1, 1968
0.763
-0.297
-28.06%
jan 1, 1969
0.765
+0.002
0.3%
jan 1, 1970
0.619
-0.147
-19.16%
jan 1, 1971
0.71
+0.091
14.78%
jan 1, 1972
1.011
+0.301
42.35%
jan 1, 1973
0.56
-0.451
-44.63%
jan 1, 1974
0.759
+0.199
35.56%
jan 1, 1975
0.612
-0.146
-19.3%
jan 1, 1976
0.556
-0.056
-9.15%
jan 1, 1977
0.536
-0.02
-3.55%
jan 1, 1978
0.833
+0.297
55.28%
jan 1, 1979
0.982
+0.149
17.84%
jan 1, 1980
0.996
+0.015
1.49%
jan 1, 1981
0.951
-0.045
-4.53%
jan 1, 1982
0.703
-0.249
-26.13%
jan 1, 1983
0.67
-0.032
-4.57%
jan 1, 1984
0.866
+0.195
29.11%
jan 1, 1985
0.911
+0.045
5.18%
jan 1, 1986
0.877
-0.033
-3.68%
jan 1, 1987
1.051
+0.174
19.87%
jan 1, 1988
1.603
+0.551
52.45%
jan 1, 1989
1.919
+0.316
19.74%
jan 1, 1990
2.177
+0.258
13.45%
jan 1, 1991
2.539
+0.362
16.62%
jan 1, 1992
2.601
+0.062
2.43%
jan 1, 1993
3.018
+0.417
16.04%
jan 1, 1994
3.126
+0.108
3.57%
jan 1, 1995
3.21
+0.084
2.68%
jan 1, 1996
3.808
+0.598
18.63%
jan 1, 1997
3.698
-0.109
-2.87%
jan 1, 1998
6.288
+2.589
70.01%
jan 1, 1999
6.402
+0.114
1.81%
jan 1, 2000
6.56
+0.158
2.47%
jan 1, 2001
7.308
+0.749
11.41%
jan 1, 2002
7.145
-0.163
-2.23%
jan 1, 2003
7.662
+0.516
7.22%
jan 1, 2004
8.251
+0.589
7.69%
jan 1, 2005
8.517
+0.267
3.23%
jan 1, 2006
9.206
+0.689
8.09%
jan 1, 2007
10.408
+1.202
13.06%
jan 1, 2008
11.445
+1.037
9.96%
jan 1, 2009
12.307
+0.862
7.53%
jan 1, 2010
12.758
+0.451
3.66%
jan 1, 2011
13.266
+0.508
3.99%
jan 1, 2012
13.762
+0.496
3.74%
jan 1, 2013
14.23
+0.468
3.4%
jan 1, 2014
14.756
+0.526
3.7%
jan 1, 2015
16.176
+1.42
9.62%
Ranking of countries by current statistics by years


Comments: