29
/
en
AIzaSyAYiBZKx7MnpbEhh9jyipgxe19OcubqV5w
April 1, 2024
162844
Jamaica
JAM
true
2
1
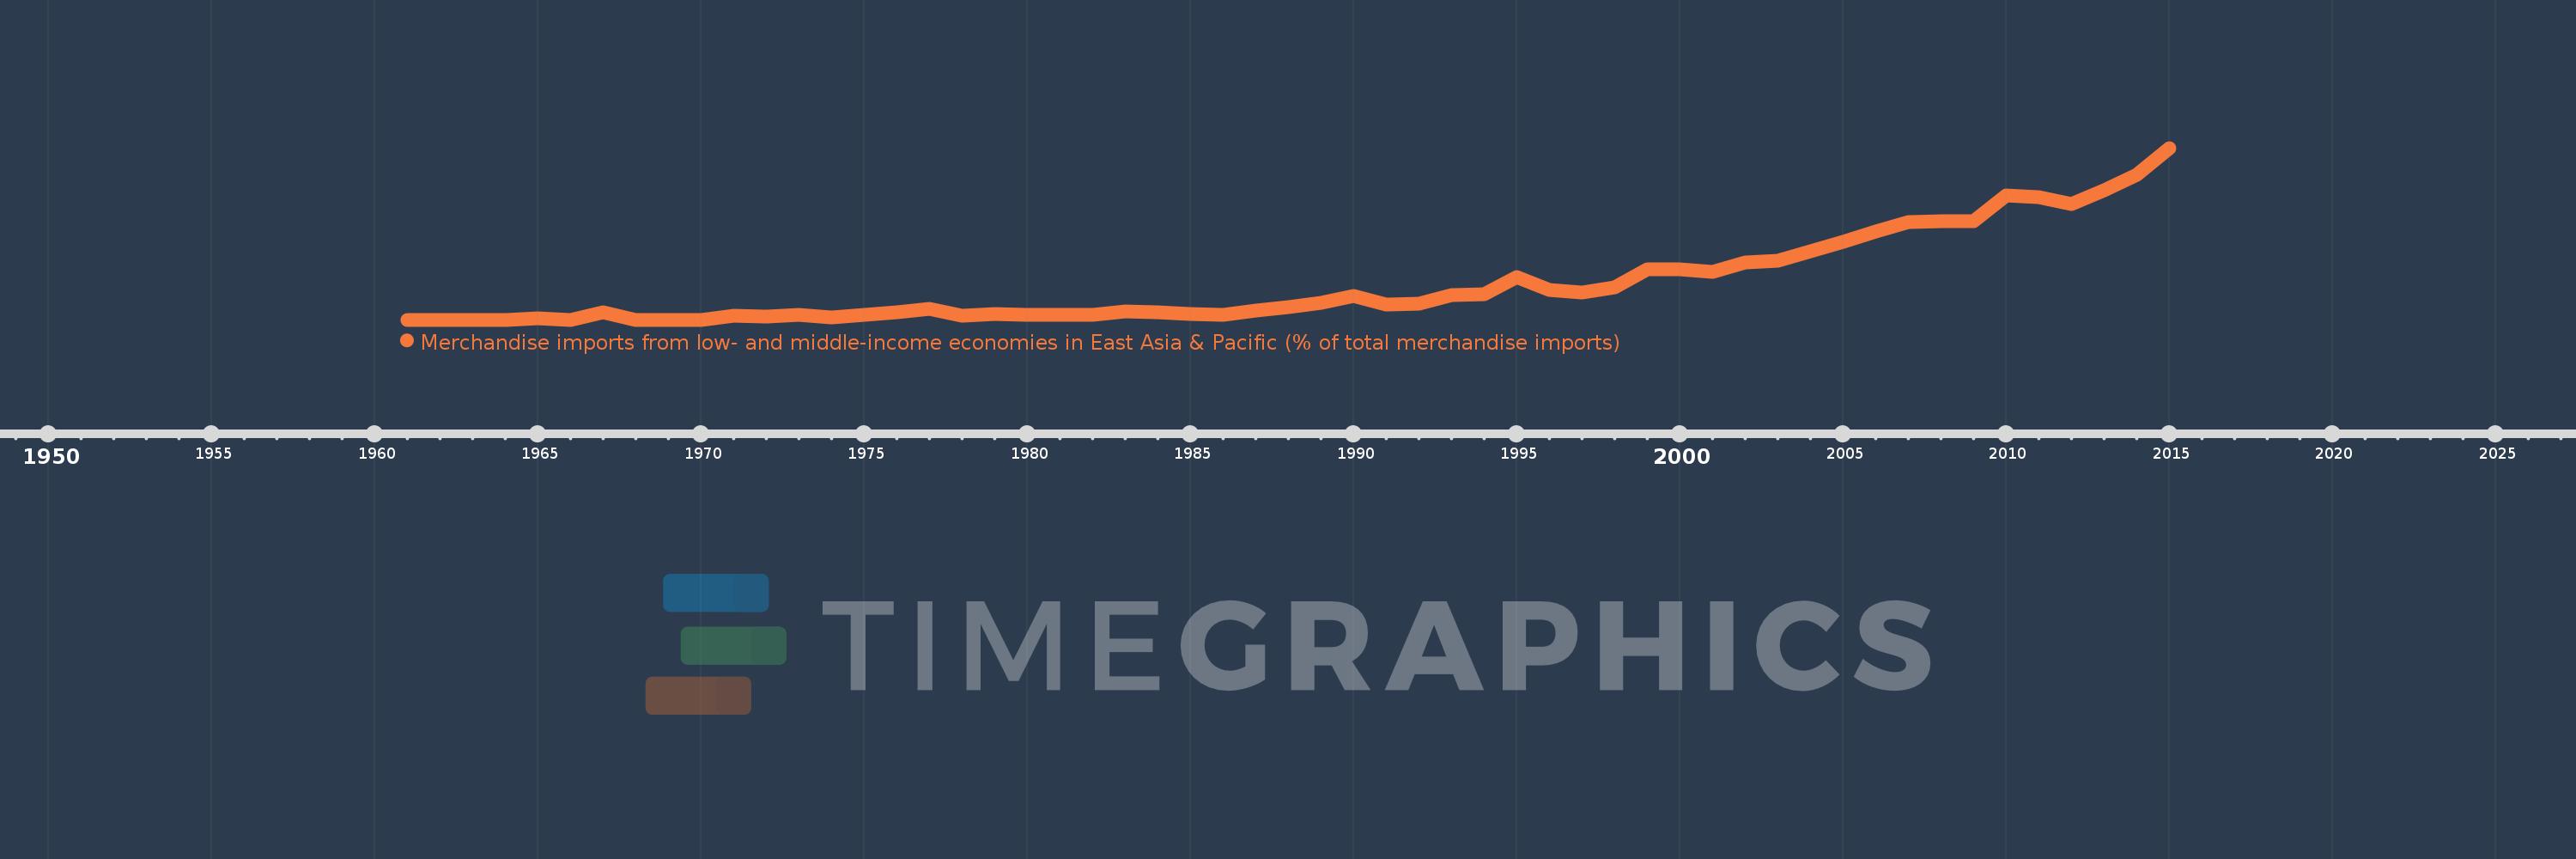
Merchandise imports from low- and middle-income economies in East Asia & Pacific (% of total merchandise imports)
2015,2014,2013,2012,2011,2010,2009,2008,2007,2006,2005,2004,2003,2002,2001,2000,1999,1998,1997,1996,1995,1994,1993,1992,1991,1990,1989,1988,1987,1986,1985,1984,1983,1982,1981,1980,1979,1978,1977,1976,1975,1974,1973,1972,1971,1970,1969,1968,1967,1966,1965,1964,1963,1962,1961
This statistics in other country:
AfghanistanAlbaniaAlgeriaArab WorldArgentinaArmeniaArubaAustraliaAustriaAzerbaijanBahamas, TheBahrainBangladeshBarbadosBelarusBelgiumBelizeBeninBermudaBoliviaBrazilBrunei DarussalamBulgariaBurkina FasoBurundiCabo VerdeCambodiaCameroonCanadaCaribbean small statesCentral African RepublicCentral Europe and the BalticsChileChinaColombiaCongo, Rep.Costa RicaCote d'IvoireCroatiaCyprusCzech RepublicDenmarkDominicaDominican RepublicEarly-demographic dividendEast Asia & PacificEast Asia & Pacific (excluding high income)East Asia & Pacific (IDA & IBRD countries)EcuadorEgypt, Arab Rep.El SalvadorEstoniaEthiopiaEuro areaEurope & Central AsiaEurope & Central Asia (excluding high income)Europe & Central Asia (IDA & IBRD countries)European UnionFijiFinlandFragile and conflict affected situationsFranceFrench PolynesiaGabonGambia, TheGeorgiaGermanyGhanaGreeceGreenlandGrenadaGuatemalaHaitiHeavily indebted poor countries (HIPC)High incomeHondurasHong Kong SAR, ChinaHungaryIBRD onlyIcelandIDA & IBRD totalIDA blendIDA onlyIDA totalIndiaIndonesiaIran, Islamic Rep.IraqIrelandIsraelItalyJamaicaJapanJordanKazakhstanKenyaKorea, Dem. People’s Rep.Korea, Rep.KuwaitKyrgyz RepublicLao PDRLate-demographic dividendLatin America & Caribbean Latin America & Caribbean (excluding high income)Latin America & the Caribbean (IDA & IBRD countries)LatviaLeast developed countries: UN classificationLebanonLithuaniaLow & middle incomeLow incomeLower middle incomeLuxembourgMacao SAR, ChinaMacedonia, FYRMadagascarMalaysiaMaliMaltaMauritiusMexicoMiddle East & North AfricaMiddle East & North Africa (excluding high income)Middle East & North Africa (IDA & IBRD countries)Middle incomeMoldovaMongoliaMontenegroMoroccoMyanmarNetherlandsNew CaledoniaNew ZealandNicaraguaNigerNigeriaNorth AmericaNorwayOECD membersOmanOther small statesPacific island small statesPakistanPanamaPapua New GuineaParaguayPeruPhilippinesPolandPortugalPost-demographic dividendPre-demographic dividendQatarRomaniaRussian FederationSamoaSaudi ArabiaSenegalSerbiaSingaporeSlovak RepublicSloveniaSmall statesSolomon IslandsSomaliaSouth AfricaSouth AsiaSouth Asia (IDA & IBRD)SpainSri LankaSt. Kitts and NevisSt. LuciaSt. Vincent and the GrenadinesSub-Saharan Africa Sub-Saharan Africa (excluding high income)Sub-Saharan Africa (IDA & IBRD countries)SurinameSwedenSwitzerlandTanzaniaThailandTogoTongaTrinidad and TobagoTunisiaTurkeyUgandaUkraineUnited Arab EmiratesUnited KingdomUnited StatesUpper middle incomeUruguayVanuatuVenezuela, RBVietnamWorldYemen, Rep.ZambiaZimbabwe Timeline:
This timeline shows a graph from 1961 to 2015 of Jamaica. No data until 1960. Number of actual observations by date: 55.
Source name:
World Development Indicators
Source organization:
World Bank staff estimates based data from International Monetary Fund's Direction of Trade database.
Categories, topics:
Private Sector, Trade
Last updated:
apr 23, 2017
Indicators value changes by year
At the date of observation
Value
Absolute change
Change from previous value
jan 1, 1965
0.071
+0.071
%
jan 1, 1966
0.0
-0.071
-100.0%
jan 1, 1967
0.373
+0.373
%
jan 1, 1968
0.0
-0.373
-100.0%
jan 1, 1971
0.188
+0.188
%
jan 1, 1972
0.172
-0.016
-8.75%
jan 1, 1973
0.219
+0.048
27.7%
jan 1, 1974
0.125
-0.094
-42.93%
jan 1, 1975
0.25
+0.125
99.43%
jan 1, 1976
0.375
+0.125
50.06%
jan 1, 1977
0.54
+0.165
44.1%
jan 1, 1978
0.2
-0.34
-62.92%
jan 1, 1979
0.277
+0.076
38.15%
jan 1, 1980
0.223
-0.053
-19.21%
jan 1, 1981
0.24
+0.017
7.5%
jan 1, 1982
0.224
-0.016
-6.8%
jan 1, 1983
0.409
+0.185
82.69%
jan 1, 1984
0.362
-0.047
-11.55%
jan 1, 1985
0.281
-0.081
-22.33%
jan 1, 1986
0.246
-0.035
-12.59%
jan 1, 1987
0.429
+0.184
74.76%
jan 1, 1988
0.616
+0.186
43.38%
jan 1, 1989
0.809
+0.194
31.49%
jan 1, 1990
1.156
+0.346
42.79%
jan 1, 1991
0.759
-0.396
-34.29%
jan 1, 1992
0.783
+0.024
3.1%
jan 1, 1993
1.185
+0.402
51.39%
jan 1, 1994
1.235
+0.05
4.23%
jan 1, 1995
2.082
+0.846
68.52%
jan 1, 1996
1.468
-0.614
-29.48%
jan 1, 1997
1.33
-0.138
-9.43%
jan 1, 1998
1.574
+0.244
18.36%
jan 1, 1999
2.466
+0.892
56.68%
jan 1, 2000
2.461
-0.005
-0.2%
jan 1, 2001
2.354
-0.106
-4.32%
jan 1, 2002
2.779
+0.425
18.03%
jan 1, 2003
2.9
+0.121
4.36%
jan 1, 2004
3.346
+0.446
15.38%
jan 1, 2005
3.804
+0.458
13.68%
jan 1, 2006
4.309
+0.505
13.28%
jan 1, 2007
4.782
+0.472
10.96%
jan 1, 2008
4.829
+0.047
0.99%
jan 1, 2009
4.798
-0.031
-0.64%
jan 1, 2010
6.084
+1.286
26.81%
jan 1, 2011
5.996
-0.088
-1.45%
jan 1, 2012
5.647
-0.349
-5.81%
jan 1, 2013
6.314
+0.667
11.81%
jan 1, 2014
7.079
+0.765
12.12%
jan 1, 2015
8.389
+1.31
18.5%
Ranking of countries by current statistics by years


Comments: