29
/
en
AIzaSyAYiBZKx7MnpbEhh9jyipgxe19OcubqV5w
April 1, 2024
39201
IDA only
IDX
false
2
1
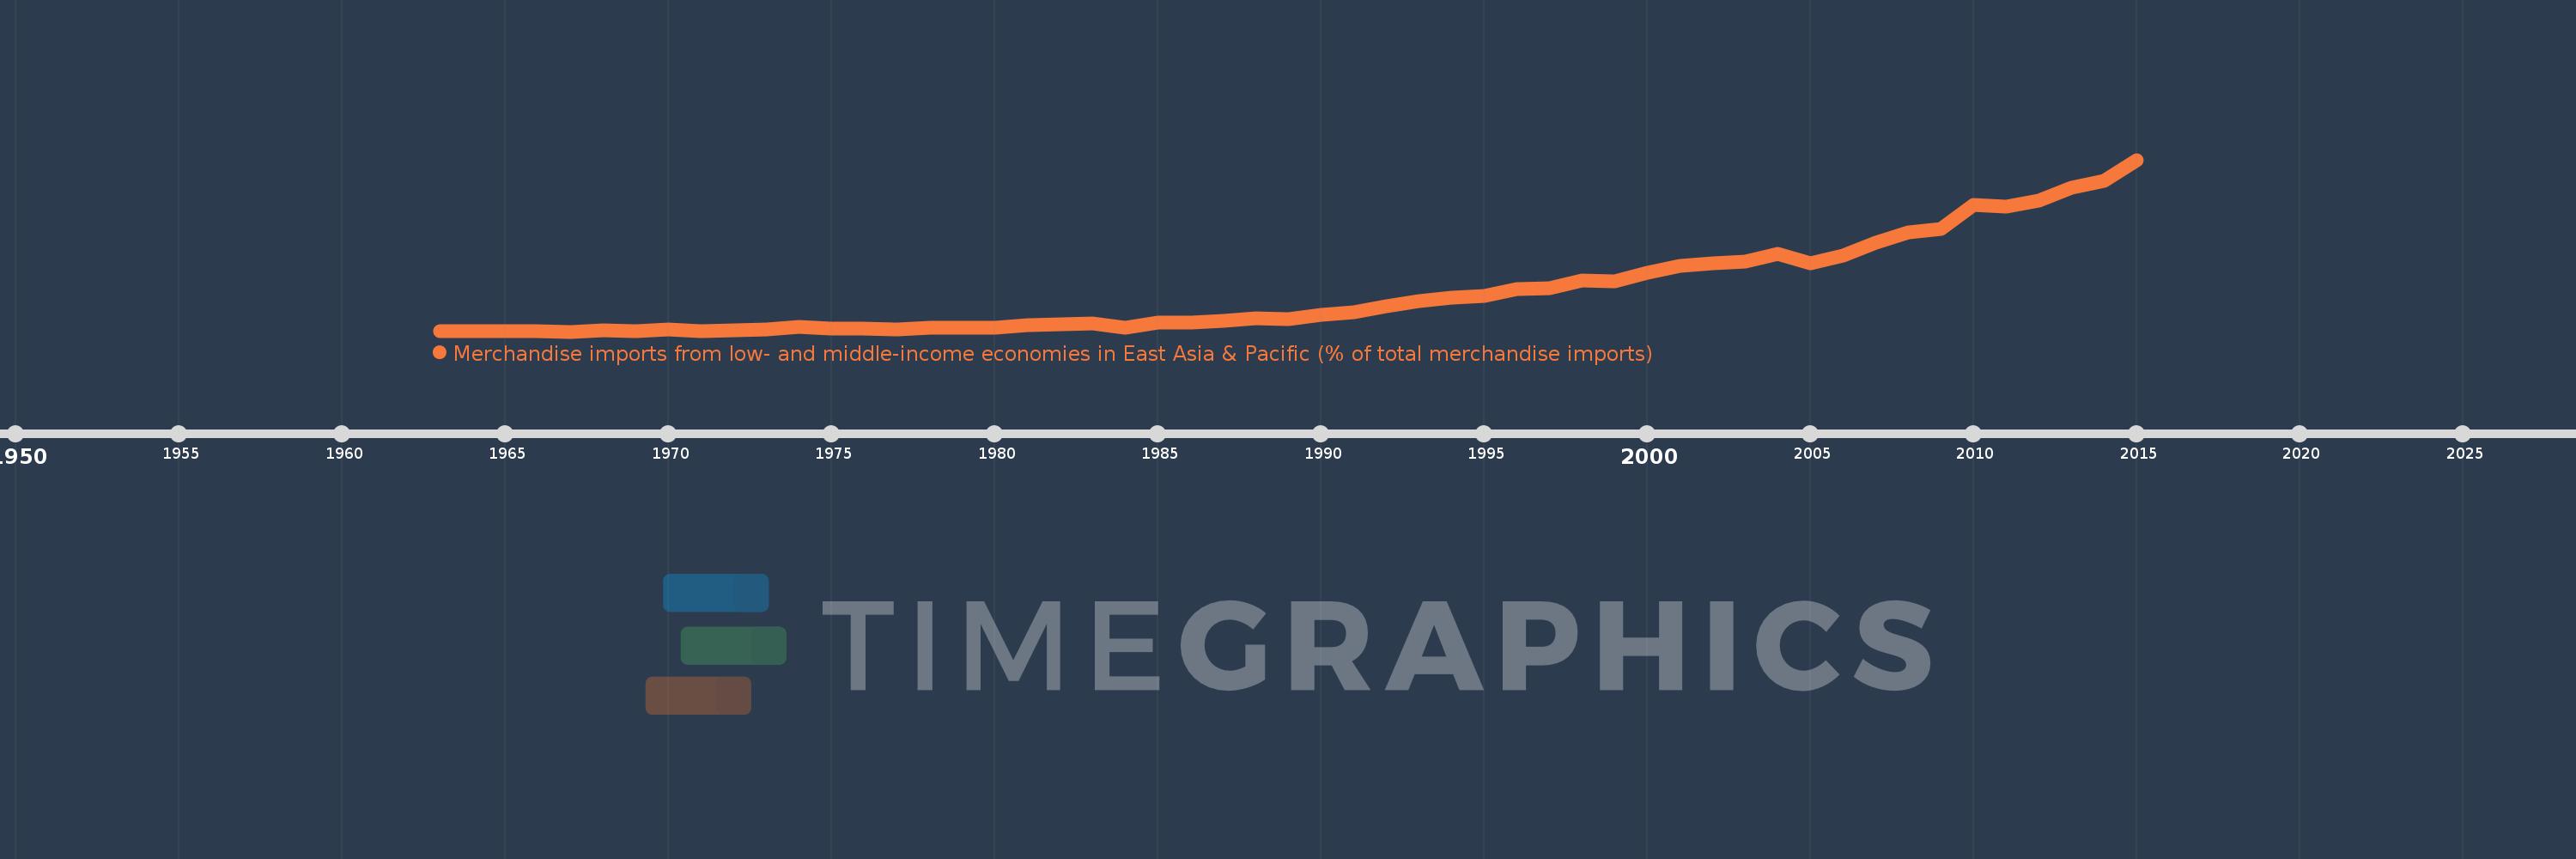
Merchandise imports from low- and middle-income economies in East Asia & Pacific (% of total merchandise imports)
2015,2014,2013,2012,2011,2010,2009,2008,2007,2006,2005,2004,2003,2002,2001,2000,1999,1998,1997,1996,1995,1994,1993,1992,1991,1990,1989,1988,1987,1986,1985,1984,1983,1982,1981,1980,1979,1978,1977,1976,1975,1974,1973,1972,1971,1970,1969,1968,1967,1966,1965,1964,1963
This statistics in other country:
AfghanistanAlbaniaAlgeriaArab WorldArgentinaArmeniaArubaAustraliaAustriaAzerbaijanBahamas, TheBahrainBangladeshBarbadosBelarusBelgiumBelizeBeninBermudaBoliviaBrazilBrunei DarussalamBulgariaBurkina FasoBurundiCabo VerdeCambodiaCameroonCanadaCaribbean small statesCentral African RepublicCentral Europe and the BalticsChileChinaColombiaCongo, Rep.Costa RicaCote d'IvoireCroatiaCyprusCzech RepublicDenmarkDominicaDominican RepublicEarly-demographic dividendEast Asia & PacificEast Asia & Pacific (excluding high income)East Asia & Pacific (IDA & IBRD countries)EcuadorEgypt, Arab Rep.El SalvadorEstoniaEthiopiaEuro areaEurope & Central AsiaEurope & Central Asia (excluding high income)Europe & Central Asia (IDA & IBRD countries)European UnionFijiFinlandFragile and conflict affected situationsFranceFrench PolynesiaGabonGambia, TheGeorgiaGermanyGhanaGreeceGreenlandGrenadaGuatemalaHaitiHeavily indebted poor countries (HIPC)High incomeHondurasHong Kong SAR, ChinaHungaryIBRD onlyIcelandIDA & IBRD totalIDA blendIDA onlyIDA totalIndiaIndonesiaIran, Islamic Rep.IraqIrelandIsraelItalyJamaicaJapanJordanKazakhstanKenyaKorea, Dem. People’s Rep.Korea, Rep.KuwaitKyrgyz RepublicLao PDRLate-demographic dividendLatin America & Caribbean Latin America & Caribbean (excluding high income)Latin America & the Caribbean (IDA & IBRD countries)LatviaLeast developed countries: UN classificationLebanonLithuaniaLow & middle incomeLow incomeLower middle incomeLuxembourgMacao SAR, ChinaMacedonia, FYRMadagascarMalaysiaMaliMaltaMauritiusMexicoMiddle East & North AfricaMiddle East & North Africa (excluding high income)Middle East & North Africa (IDA & IBRD countries)Middle incomeMoldovaMongoliaMontenegroMoroccoMyanmarNetherlandsNew CaledoniaNew ZealandNicaraguaNigerNigeriaNorth AmericaNorwayOECD membersOmanOther small statesPacific island small statesPakistanPanamaPapua New GuineaParaguayPeruPhilippinesPolandPortugalPost-demographic dividendPre-demographic dividendQatarRomaniaRussian FederationSamoaSaudi ArabiaSenegalSerbiaSingaporeSlovak RepublicSloveniaSmall statesSolomon IslandsSomaliaSouth AfricaSouth AsiaSouth Asia (IDA & IBRD)SpainSri LankaSt. Kitts and NevisSt. LuciaSt. Vincent and the GrenadinesSub-Saharan Africa Sub-Saharan Africa (excluding high income)Sub-Saharan Africa (IDA & IBRD countries)SurinameSwedenSwitzerlandTanzaniaThailandTogoTongaTrinidad and TobagoTunisiaTurkeyUgandaUkraineUnited Arab EmiratesUnited KingdomUnited StatesUpper middle incomeUruguayVanuatuVenezuela, RBVietnamWorldYemen, Rep.ZambiaZimbabwe Timeline:
This timeline shows a graph from 1963 to 2015 of IDA only. No data until 1962. Number of actual observations by date: 53.
Source name:
World Development Indicators
Source organization:
World Bank staff estimates based data from International Monetary Fund's Direction of Trade database.
Categories, topics:
Private Sector, Trade
Last updated:
apr 23, 2017
Indicators value changes by year
Maximum:
23.789
jan 1, 2015
At the date of observation
Value
Absolute change
Change from previous value
jan 1, 1963
0.066
+0.066
0.0%
jan 1, 1964
0.096
+0.03
45.62%
jan 1, 1965
0.129
+0.033
34.4%
jan 1, 1966
0.119
-0.01
-8.06%
jan 1, 1967
0.029
-0.09
-75.51%
jan 1, 1968
0.168
+0.139
475.44%
jan 1, 1969
0.098
-0.069
-41.37%
jan 1, 1970
0.279
+0.181
184.08%
jan 1, 1971
0.099
-0.18
-64.49%
jan 1, 1972
0.241
+0.142
143.0%
jan 1, 1973
0.344
+0.103
42.7%
jan 1, 1974
0.705
+0.361
104.84%
jan 1, 1975
0.488
-0.217
-30.8%
jan 1, 1976
0.406
-0.081
-16.64%
jan 1, 1977
0.307
-0.1
-24.5%
jan 1, 1978
0.561
+0.254
82.79%
jan 1, 1979
0.584
+0.023
4.09%
jan 1, 1980
0.607
+0.023
4.02%
jan 1, 1981
0.913
+0.306
50.32%
jan 1, 1982
1.022
+0.109
11.99%
jan 1, 1983
1.126
+0.103
10.11%
jan 1, 1984
0.545
-0.58
-51.55%
jan 1, 1985
1.304
+0.758
138.99%
jan 1, 1986
1.271
-0.033
-2.5%
jan 1, 1987
1.497
+0.226
17.75%
jan 1, 1988
1.887
+0.39
26.09%
jan 1, 1989
1.731
-0.156
-8.27%
jan 1, 1990
2.403
+0.671
38.79%
jan 1, 1991
2.688
+0.285
11.87%
jan 1, 1992
3.593
+0.905
33.67%
jan 1, 1993
4.22
+0.627
17.45%
jan 1, 1994
4.669
+0.449
10.65%
jan 1, 1995
4.928
+0.259
5.54%
jan 1, 1996
5.943
+1.016
20.61%
jan 1, 1997
6.037
+0.094
1.58%
jan 1, 1998
7.144
+1.106
18.32%
jan 1, 1999
7.016
-0.128
-1.79%
jan 1, 2000
8.163
+1.148
16.36%
jan 1, 2001
9.115
+0.951
11.65%
jan 1, 2002
9.458
+0.343
3.77%
jan 1, 2003
9.663
+0.205
2.16%
jan 1, 2004
10.775
+1.112
11.51%
jan 1, 2005
9.441
-1.334
-12.38%
jan 1, 2006
10.54
+1.099
11.64%
jan 1, 2007
12.311
+1.772
16.81%
jan 1, 2008
13.729
+1.417
11.51%
jan 1, 2009
14.226
+0.498
3.62%
jan 1, 2010
17.546
+3.32
23.33%
jan 1, 2011
17.367
-0.179
-1.02%
jan 1, 2012
18.194
+0.827
4.76%
jan 1, 2013
19.919
+1.725
9.48%
jan 1, 2014
20.895
+0.976
4.9%
jan 1, 2015
23.789
+2.894
13.85%
Ranking of countries by current statistics by years


Comments: