29
/
en
AIzaSyAYiBZKx7MnpbEhh9jyipgxe19OcubqV5w
April 1, 2024
139530
Germany
DEU
true
2
1
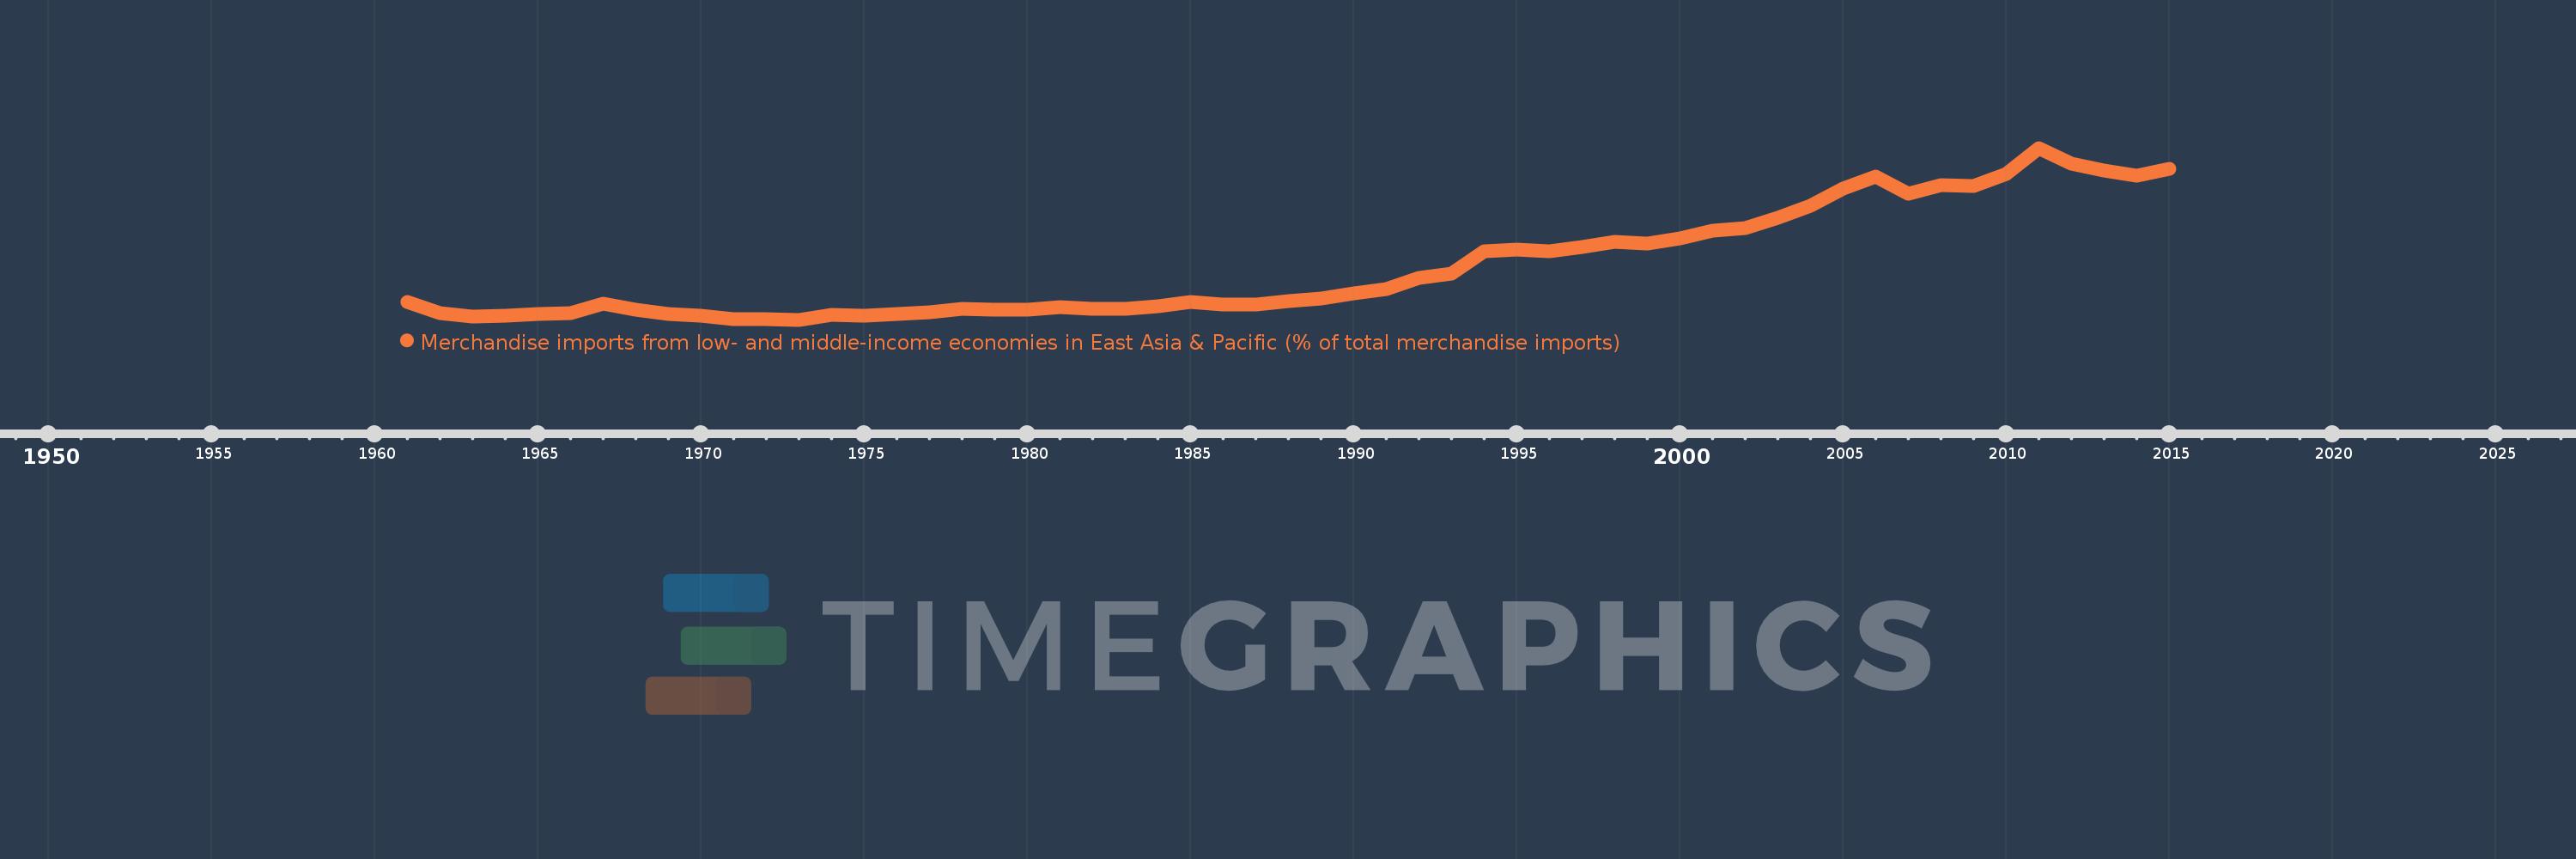
Merchandise imports from low- and middle-income economies in East Asia & Pacific (% of total merchandise imports)
2015,2014,2013,2012,2011,2010,2009,2008,2007,2006,2005,2004,2003,2002,2001,2000,1999,1998,1997,1996,1995,1994,1993,1992,1991,1990,1989,1988,1987,1986,1985,1984,1983,1982,1981,1980,1979,1978,1977,1976,1975,1974,1973,1972,1971,1970,1969,1968,1967,1966,1965,1964,1963,1962,1961
This statistics in other country:
AfghanistanAlbaniaAlgeriaArab WorldArgentinaArmeniaArubaAustraliaAustriaAzerbaijanBahamas, TheBahrainBangladeshBarbadosBelarusBelgiumBelizeBeninBermudaBoliviaBrazilBrunei DarussalamBulgariaBurkina FasoBurundiCabo VerdeCambodiaCameroonCanadaCaribbean small statesCentral African RepublicCentral Europe and the BalticsChileChinaColombiaCongo, Rep.Costa RicaCote d'IvoireCroatiaCyprusCzech RepublicDenmarkDominicaDominican RepublicEarly-demographic dividendEast Asia & PacificEast Asia & Pacific (excluding high income)East Asia & Pacific (IDA & IBRD countries)EcuadorEgypt, Arab Rep.El SalvadorEstoniaEthiopiaEuro areaEurope & Central AsiaEurope & Central Asia (excluding high income)Europe & Central Asia (IDA & IBRD countries)European UnionFijiFinlandFragile and conflict affected situationsFranceFrench PolynesiaGabonGambia, TheGeorgiaGermanyGhanaGreeceGreenlandGrenadaGuatemalaHaitiHeavily indebted poor countries (HIPC)High incomeHondurasHong Kong SAR, ChinaHungaryIBRD onlyIcelandIDA & IBRD totalIDA blendIDA onlyIDA totalIndiaIndonesiaIran, Islamic Rep.IraqIrelandIsraelItalyJamaicaJapanJordanKazakhstanKenyaKorea, Dem. People’s Rep.Korea, Rep.KuwaitKyrgyz RepublicLao PDRLate-demographic dividendLatin America & Caribbean Latin America & Caribbean (excluding high income)Latin America & the Caribbean (IDA & IBRD countries)LatviaLeast developed countries: UN classificationLebanonLithuaniaLow & middle incomeLow incomeLower middle incomeLuxembourgMacao SAR, ChinaMacedonia, FYRMadagascarMalaysiaMaliMaltaMauritiusMexicoMiddle East & North AfricaMiddle East & North Africa (excluding high income)Middle East & North Africa (IDA & IBRD countries)Middle incomeMoldovaMongoliaMontenegroMoroccoMyanmarNetherlandsNew CaledoniaNew ZealandNicaraguaNigerNigeriaNorth AmericaNorwayOECD membersOmanOther small statesPacific island small statesPakistanPanamaPapua New GuineaParaguayPeruPhilippinesPolandPortugalPost-demographic dividendPre-demographic dividendQatarRomaniaRussian FederationSamoaSaudi ArabiaSenegalSerbiaSingaporeSlovak RepublicSloveniaSmall statesSolomon IslandsSomaliaSouth AfricaSouth AsiaSouth Asia (IDA & IBRD)SpainSri LankaSt. Kitts and NevisSt. LuciaSt. Vincent and the GrenadinesSub-Saharan Africa Sub-Saharan Africa (excluding high income)Sub-Saharan Africa (IDA & IBRD countries)SurinameSwedenSwitzerlandTanzaniaThailandTogoTongaTrinidad and TobagoTunisiaTurkeyUgandaUkraineUnited Arab EmiratesUnited KingdomUnited StatesUpper middle incomeUruguayVanuatuVenezuela, RBVietnamWorldYemen, Rep.ZambiaZimbabwe Timeline:
This timeline shows a graph from 1961 to 2015 of Germany. No data until 1960. Number of actual observations by date: 55.
Source name:
World Development Indicators
Source organization:
World Bank staff estimates based data from International Monetary Fund's Direction of Trade database.
Categories, topics:
Private Sector, Trade
Last updated:
apr 23, 2017
Indicators value changes by year
At the date of observation
Value
Absolute change
Change from previous value
jan 1, 1961
2.107
+2.107
0.0%
jan 1, 1962
1.581
-0.527
-24.99%
jan 1, 1963
1.397
-0.184
-11.61%
jan 1, 1964
1.421
+0.024
1.69%
jan 1, 1965
1.524
+0.103
7.26%
jan 1, 1966
1.557
+0.033
2.17%
jan 1, 1967
2.027
+0.47
30.2%
jan 1, 1968
1.739
-0.288
-14.2%
jan 1, 1969
1.537
-0.202
-11.62%
jan 1, 1970
1.446
-0.091
-5.95%
jan 1, 1971
1.275
-0.171
-11.8%
jan 1, 1972
1.256
-0.019
-1.52%
jan 1, 1973
1.241
-0.015
-1.18%
jan 1, 1974
1.47
+0.229
18.45%
jan 1, 1975
1.421
-0.049
-3.31%
jan 1, 1976
1.507
+0.085
6.0%
jan 1, 1977
1.619
+0.112
7.47%
jan 1, 1978
1.777
+0.158
9.78%
jan 1, 1979
1.758
-0.019
-1.08%
jan 1, 1980
1.758
+0.0
0.02%
jan 1, 1981
1.881
+0.122
6.95%
jan 1, 1982
1.785
-0.096
-5.08%
jan 1, 1983
1.792
+0.007
0.38%
jan 1, 1984
1.91
+0.119
6.62%
jan 1, 1985
2.126
+0.215
11.26%
jan 1, 1986
2.003
-0.123
-5.77%
jan 1, 1987
2.0
-0.003
-0.14%
jan 1, 1988
2.18
+0.179
8.97%
jan 1, 1989
2.294
+0.115
5.27%
jan 1, 1990
2.541
+0.247
10.76%
jan 1, 1991
2.748
+0.207
8.15%
jan 1, 1992
3.301
+0.553
20.13%
jan 1, 1993
3.541
+0.239
7.25%
jan 1, 1994
4.627
+1.086
30.68%
jan 1, 1995
4.727
+0.1
2.15%
jan 1, 1996
4.639
-0.087
-1.85%
jan 1, 1997
4.868
+0.228
4.92%
jan 1, 1998
5.109
+0.241
4.96%
jan 1, 1999
5.039
-0.07
-1.37%
jan 1, 2000
5.271
+0.232
4.6%
jan 1, 2001
5.656
+0.385
7.31%
jan 1, 2002
5.788
+0.132
2.34%
jan 1, 2003
6.31
+0.522
9.01%
jan 1, 2004
6.898
+0.588
9.31%
jan 1, 2005
7.777
+0.879
12.74%
jan 1, 2006
8.352
+0.575
7.39%
jan 1, 2007
7.515
-0.836
-10.01%
jan 1, 2008
7.929
+0.414
5.51%
jan 1, 2009
7.887
-0.043
-0.54%
jan 1, 2010
8.485
+0.599
7.59%
jan 1, 2011
9.778
+1.293
15.24%
jan 1, 2012
8.994
-0.785
-8.03%
jan 1, 2013
8.658
-0.336
-3.74%
jan 1, 2014
8.403
-0.255
-2.94%
jan 1, 2015
8.739
+0.336
4.0%
Ranking of countries by current statistics by years


Comments: