29
/
en
AIzaSyAYiBZKx7MnpbEhh9jyipgxe19OcubqV5w
April 1, 2024
208842
New Caledonia
NCL
true
2
1
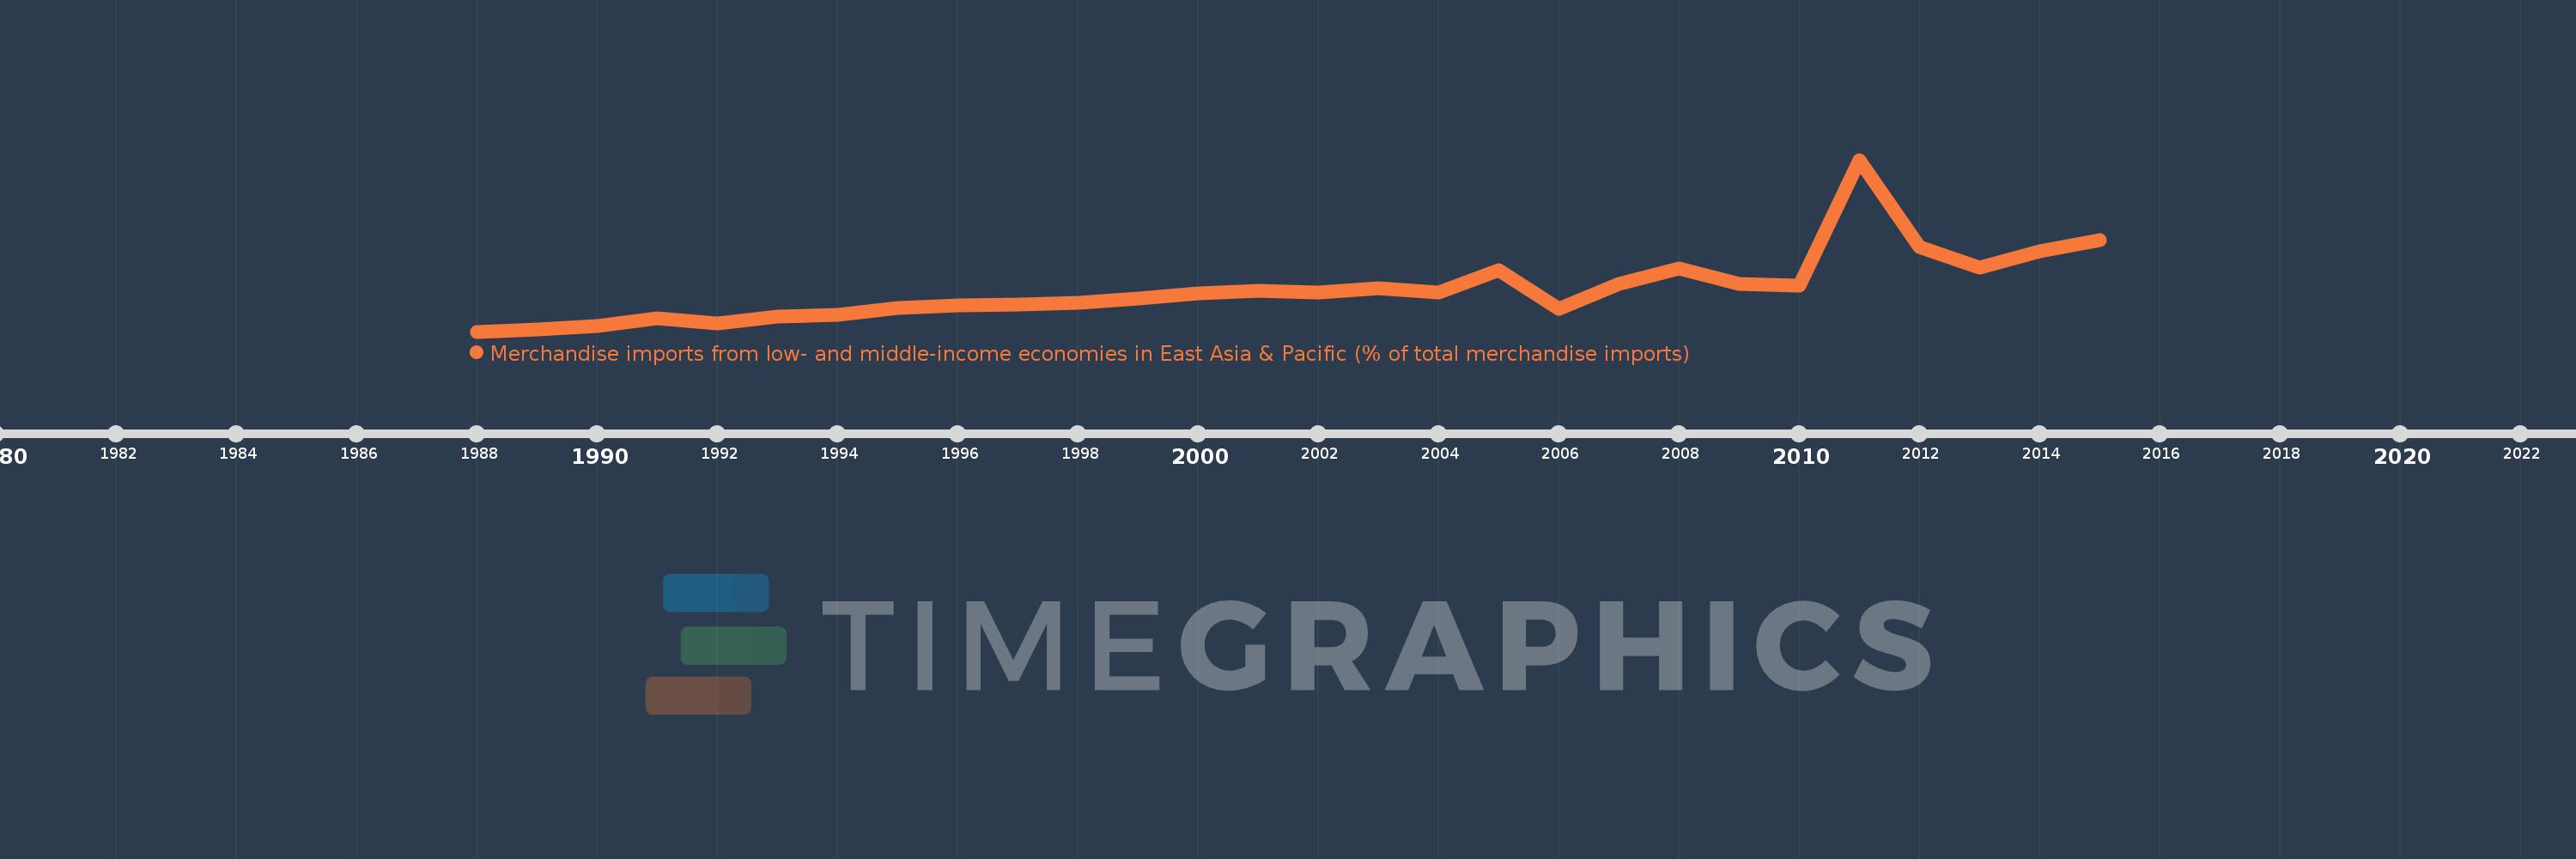
Merchandise imports from low- and middle-income economies in East Asia & Pacific (% of total merchandise imports)
2015,2014,2013,2012,2011,2010,2009,2008,2007,2006,2005,2004,2003,2002,2001,2000,1999,1998,1997,1996,1995,1994,1993,1992,1991,1990,1989,1988
This statistics in other country:
AfghanistanAlbaniaAlgeriaArab WorldArgentinaArmeniaArubaAustraliaAustriaAzerbaijanBahamas, TheBahrainBangladeshBarbadosBelarusBelgiumBelizeBeninBermudaBoliviaBrazilBrunei DarussalamBulgariaBurkina FasoBurundiCabo VerdeCambodiaCameroonCanadaCaribbean small statesCentral African RepublicCentral Europe and the BalticsChileChinaColombiaCongo, Rep.Costa RicaCote d'IvoireCroatiaCyprusCzech RepublicDenmarkDominicaDominican RepublicEarly-demographic dividendEast Asia & PacificEast Asia & Pacific (excluding high income)East Asia & Pacific (IDA & IBRD countries)EcuadorEgypt, Arab Rep.El SalvadorEstoniaEthiopiaEuro areaEurope & Central AsiaEurope & Central Asia (excluding high income)Europe & Central Asia (IDA & IBRD countries)European UnionFijiFinlandFragile and conflict affected situationsFranceFrench PolynesiaGabonGambia, TheGeorgiaGermanyGhanaGreeceGreenlandGrenadaGuatemalaHaitiHeavily indebted poor countries (HIPC)High incomeHondurasHong Kong SAR, ChinaHungaryIBRD onlyIcelandIDA & IBRD totalIDA blendIDA onlyIDA totalIndiaIndonesiaIran, Islamic Rep.IraqIrelandIsraelItalyJamaicaJapanJordanKazakhstanKenyaKorea, Dem. People’s Rep.Korea, Rep.KuwaitKyrgyz RepublicLao PDRLate-demographic dividendLatin America & Caribbean Latin America & Caribbean (excluding high income)Latin America & the Caribbean (IDA & IBRD countries)LatviaLeast developed countries: UN classificationLebanonLithuaniaLow & middle incomeLow incomeLower middle incomeLuxembourgMacao SAR, ChinaMacedonia, FYRMadagascarMalaysiaMaliMaltaMauritiusMexicoMiddle East & North AfricaMiddle East & North Africa (excluding high income)Middle East & North Africa (IDA & IBRD countries)Middle incomeMoldovaMongoliaMontenegroMoroccoMyanmarNetherlandsNew CaledoniaNew ZealandNicaraguaNigerNigeriaNorth AmericaNorwayOECD membersOmanOther small statesPacific island small statesPakistanPanamaPapua New GuineaParaguayPeruPhilippinesPolandPortugalPost-demographic dividendPre-demographic dividendQatarRomaniaRussian FederationSamoaSaudi ArabiaSenegalSerbiaSingaporeSlovak RepublicSloveniaSmall statesSolomon IslandsSomaliaSouth AfricaSouth AsiaSouth Asia (IDA & IBRD)SpainSri LankaSt. Kitts and NevisSt. LuciaSt. Vincent and the GrenadinesSub-Saharan Africa Sub-Saharan Africa (excluding high income)Sub-Saharan Africa (IDA & IBRD countries)SurinameSwedenSwitzerlandTanzaniaThailandTogoTongaTrinidad and TobagoTunisiaTurkeyUgandaUkraineUnited Arab EmiratesUnited KingdomUnited StatesUpper middle incomeUruguayVanuatuVenezuela, RBVietnamWorldYemen, Rep.ZambiaZimbabwe Timeline:
This timeline shows a graph from 1988 to 2015 of New Caledonia. No data until 1987. Number of actual observations by date: 28.
Source name:
World Development Indicators
Source organization:
World Bank staff estimates based data from International Monetary Fund's Direction of Trade database.
Categories, topics:
Private Sector, Trade
Last updated:
apr 23, 2017
Indicators value changes by year
Maximum:
18.129
jan 1, 2011
At the date of observation
Value
Absolute change
Change from previous value
jan 1, 1988
1.259
+1.259
0.0%
jan 1, 1989
1.488
+0.229
18.19%
jan 1, 1990
1.797
+0.309
20.8%
jan 1, 1991
2.53
+0.732
40.75%
jan 1, 1992
2.072
-0.458
-18.09%
jan 1, 1993
2.705
+0.633
30.55%
jan 1, 1994
2.909
+0.204
7.54%
jan 1, 1995
3.576
+0.667
22.93%
jan 1, 1996
3.804
+0.227
6.36%
jan 1, 1997
3.885
+0.081
2.13%
jan 1, 1998
4.11
+0.226
5.81%
jan 1, 1999
4.521
+0.41
9.98%
jan 1, 2000
5.053
+0.532
11.78%
jan 1, 2001
5.263
+0.21
4.16%
jan 1, 2002
5.108
-0.155
-2.95%
jan 1, 2003
5.551
+0.443
8.68%
jan 1, 2004
5.059
-0.492
-8.87%
jan 1, 2005
7.278
+2.219
43.86%
jan 1, 2006
3.491
-3.787
-52.03%
jan 1, 2007
5.927
+2.436
69.77%
jan 1, 2008
7.488
+1.561
26.35%
jan 1, 2009
5.956
-1.532
-20.46%
jan 1, 2010
5.808
-0.148
-2.48%
jan 1, 2011
18.129
+12.321
212.13%
jan 1, 2012
9.604
-8.525
-47.03%
jan 1, 2013
7.534
-2.069
-21.55%
jan 1, 2014
9.123
+1.589
21.09%
jan 1, 2015
10.265
+1.142
12.52%
Ranking of countries by current statistics by years


Comments: