29
/
en
AIzaSyAYiBZKx7MnpbEhh9jyipgxe19OcubqV5w
April 1, 2024
75979
Bahamas, The
BHS
true
2
1
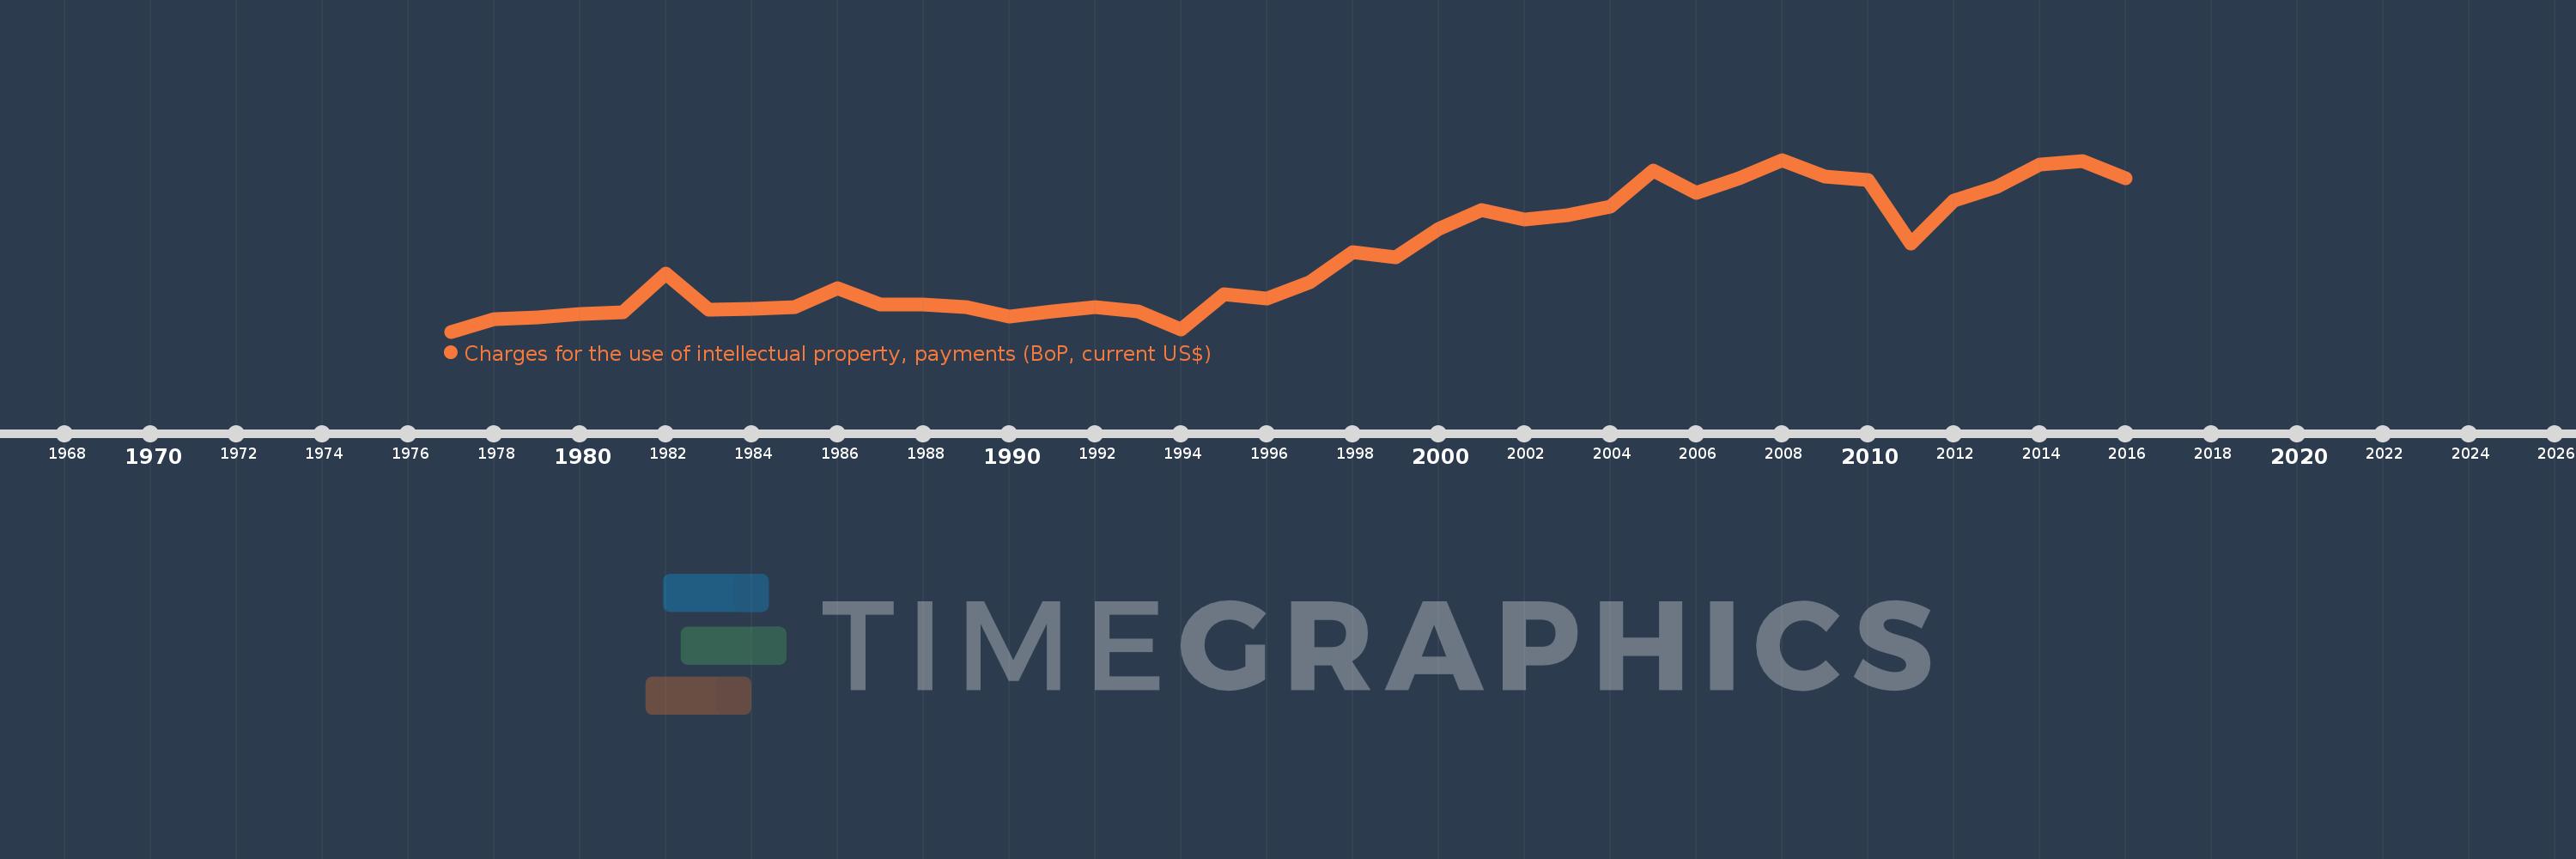
Charges for the use of intellectual property, payments (BoP, current US$)
2016,2015,2014,2013,2012,2011,2010,2009,2008,2007,2006,2005,2004,2003,2002,2001,2000,1999,1998,1997,1996,1995,1994,1993,1992,1991,1990,1989,1988,1987,1986,1985,1984,1983,1982,1981,1980,1979,1978,1977
This statistics in other country:
Timeline:
This timeline shows a graph from 1977 to 2016 of Bahamas, The. No data until 1976. Number of actual observations by date: 40.
Source name:
World Development Indicators
Source organization:
International Monetary Fund, Balance of Payments Statistics Yearbook and data files.
Categories, topics:
Economy & Growth, Science & Technology
Last updated:
apr 23, 2017
Indicators value changes by year
Minimum:
1.0 mln
jan 1, 1977
Maximum:
19.68 mln
jan 1, 2008
At the date of observation
Value
Absolute change
Change from previous value
jan 1, 1977
1.0 mln
+1.0 mln
0.0%
jan 1, 1978
2.4 mln
+1.4 mln
140.0%
jan 1, 1979
2.5 mln
+100.0K
4.17%
jan 1, 1980
2.9 mln
+400.0K
16.0%
jan 1, 1981
3.1 mln
+200.0K
6.9%
jan 1, 1982
7.3 mln
+4.2 mln
135.48%
jan 1, 1983
3.4 mln
-3.9 mln
-53.42%
jan 1, 1984
3.5 mln
+100.0K
2.94%
jan 1, 1985
3.7 mln
+200.0K
5.71%
jan 1, 1986
5.7 mln
+2.0 mln
54.05%
jan 1, 1987
3.9 mln
-1.8 mln
-31.58%
jan 1, 1988
3.9 mln
0.0
0.0%
jan 1, 1989
3.7 mln
-200.0K
-5.13%
jan 1, 1990
2.6 mln
-1.1 mln
-29.73%
jan 1, 1991
3.2 mln
+600.0K
23.08%
jan 1, 1992
3.7 mln
+500.0K
15.63%
jan 1, 1993
3.2 mln
-500.0K
-13.51%
jan 1, 1994
1.2 mln
-2.0 mln
-62.5%
jan 1, 1995
5.1 mln
+3.9 mln
325.0%
jan 1, 1996
4.6 mln
-500.0K
-9.8%
jan 1, 1997
6.4 mln
+1.8 mln
39.13%
jan 1, 1998
9.6 mln
+3.2 mln
50.0%
jan 1, 1999
9.1 mln
-500.0K
-5.21%
jan 1, 2000
12.2 mln
+3.1 mln
34.07%
jan 1, 2001
14.2 mln
+2.0 mln
16.39%
jan 1, 2002
13.2 mln
-1000.0K
-7.04%
jan 1, 2003
13.656 mln
+456.0K
3.45%
jan 1, 2004
14.6 mln
+944.0K
6.91%
jan 1, 2005
18.5 mln
+3.9 mln
26.71%
jan 1, 2006
16.087 mln
-2.413 mln
-13.04%
jan 1, 2007
17.67 mln
+1.583 mln
9.84%
jan 1, 2008
19.68 mln
+2.01 mln
11.38%
jan 1, 2009
17.89 mln
-1.79 mln
-9.1%
jan 1, 2010
17.48 mln
-410.0K
-2.29%
jan 1, 2011
10.57 mln
-6.91 mln
-39.53%
jan 1, 2012
15.272 mln
+4.702 mln
44.48%
jan 1, 2013
16.753 mln
+1.481 mln
9.7%
jan 1, 2014
19.2 mln
+2.447 mln
14.61%
jan 1, 2015
19.515 mln
+314.761K
1.64%
jan 1, 2016
17.658 mln
-1.857 mln
-9.51%
Ranking of countries by current statistics by years


Comments: