29
/
en
AIzaSyAYiBZKx7MnpbEhh9jyipgxe19OcubqV5w
April 1, 2024
93304
Bulgaria
BGR
true
2
1
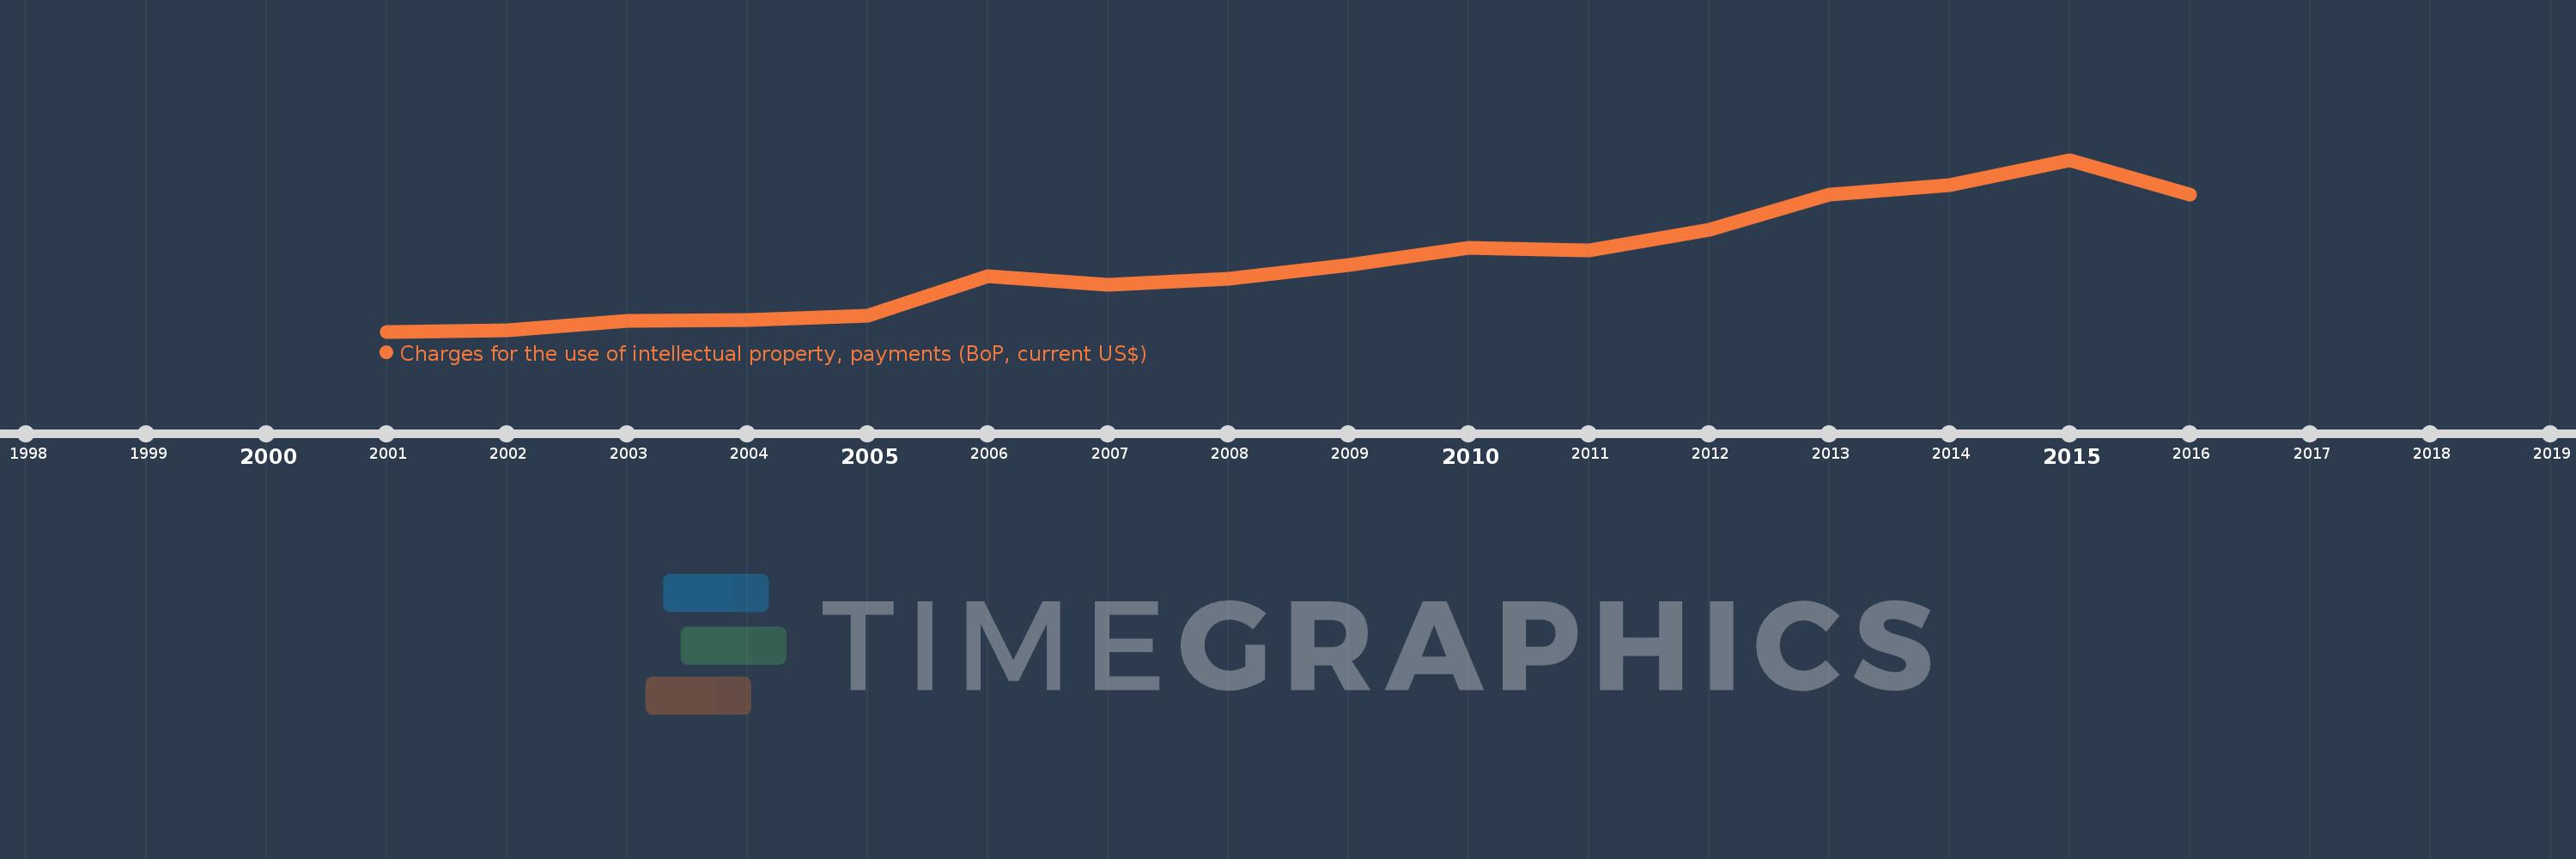
Charges for the use of intellectual property, payments (BoP, current US$)
2016,2015,2014,2013,2012,2011,2010,2009,2008,2007,2006,2005,2004,2003,2002,2001
This statistics in other country:
Timeline:
This timeline shows a graph from 2001 to 2016 of Bulgaria. No data until 2000. Number of actual observations by date: 16.
Source name:
World Development Indicators
Source organization:
International Monetary Fund, Balance of Payments Statistics Yearbook and data files.
Categories, topics:
Economy & Growth, Science & Technology
Last updated:
apr 23, 2017
Indicators value changes by year
Minimum:
9.861 mln
jan 1, 2001
Maximum:
229.82 mln
jan 1, 2015
At the date of observation
Value
Absolute change
Change from previous value
jan 1, 2001
9.861 mln
+9.861 mln
0.0%
jan 1, 2002
11.474 mln
+1.613 mln
16.36%
jan 1, 2003
23.347 mln
+11.873 mln
103.48%
jan 1, 2004
24.434 mln
+1.087 mln
4.65%
jan 1, 2005
30.52 mln
+6.087 mln
24.91%
jan 1, 2006
80.611 mln
+50.091 mln
164.12%
jan 1, 2007
69.439 mln
-11.172 mln
-13.86%
jan 1, 2008
77.561 mln
+8.122 mln
11.7%
jan 1, 2009
95.185 mln
+17.624 mln
22.72%
jan 1, 2010
117.24 mln
+22.054 mln
23.17%
jan 1, 2011
114.24 mln
-3.0 mln
-2.56%
jan 1, 2012
140.18 mln
+25.94 mln
22.71%
jan 1, 2013
184.75 mln
+44.57 mln
31.79%
jan 1, 2014
197.87 mln
+13.12 mln
7.1%
jan 1, 2015
229.82 mln
+31.95 mln
16.15%
jan 1, 2016
185.11 mln
-44.71 mln
-19.45%
Ranking of countries by current statistics by years


Comments: