29
/
en
AIzaSyAYiBZKx7MnpbEhh9jyipgxe19OcubqV5w
April 1, 2024
25534
Central Europe and the Baltics
CEB
false
2
1
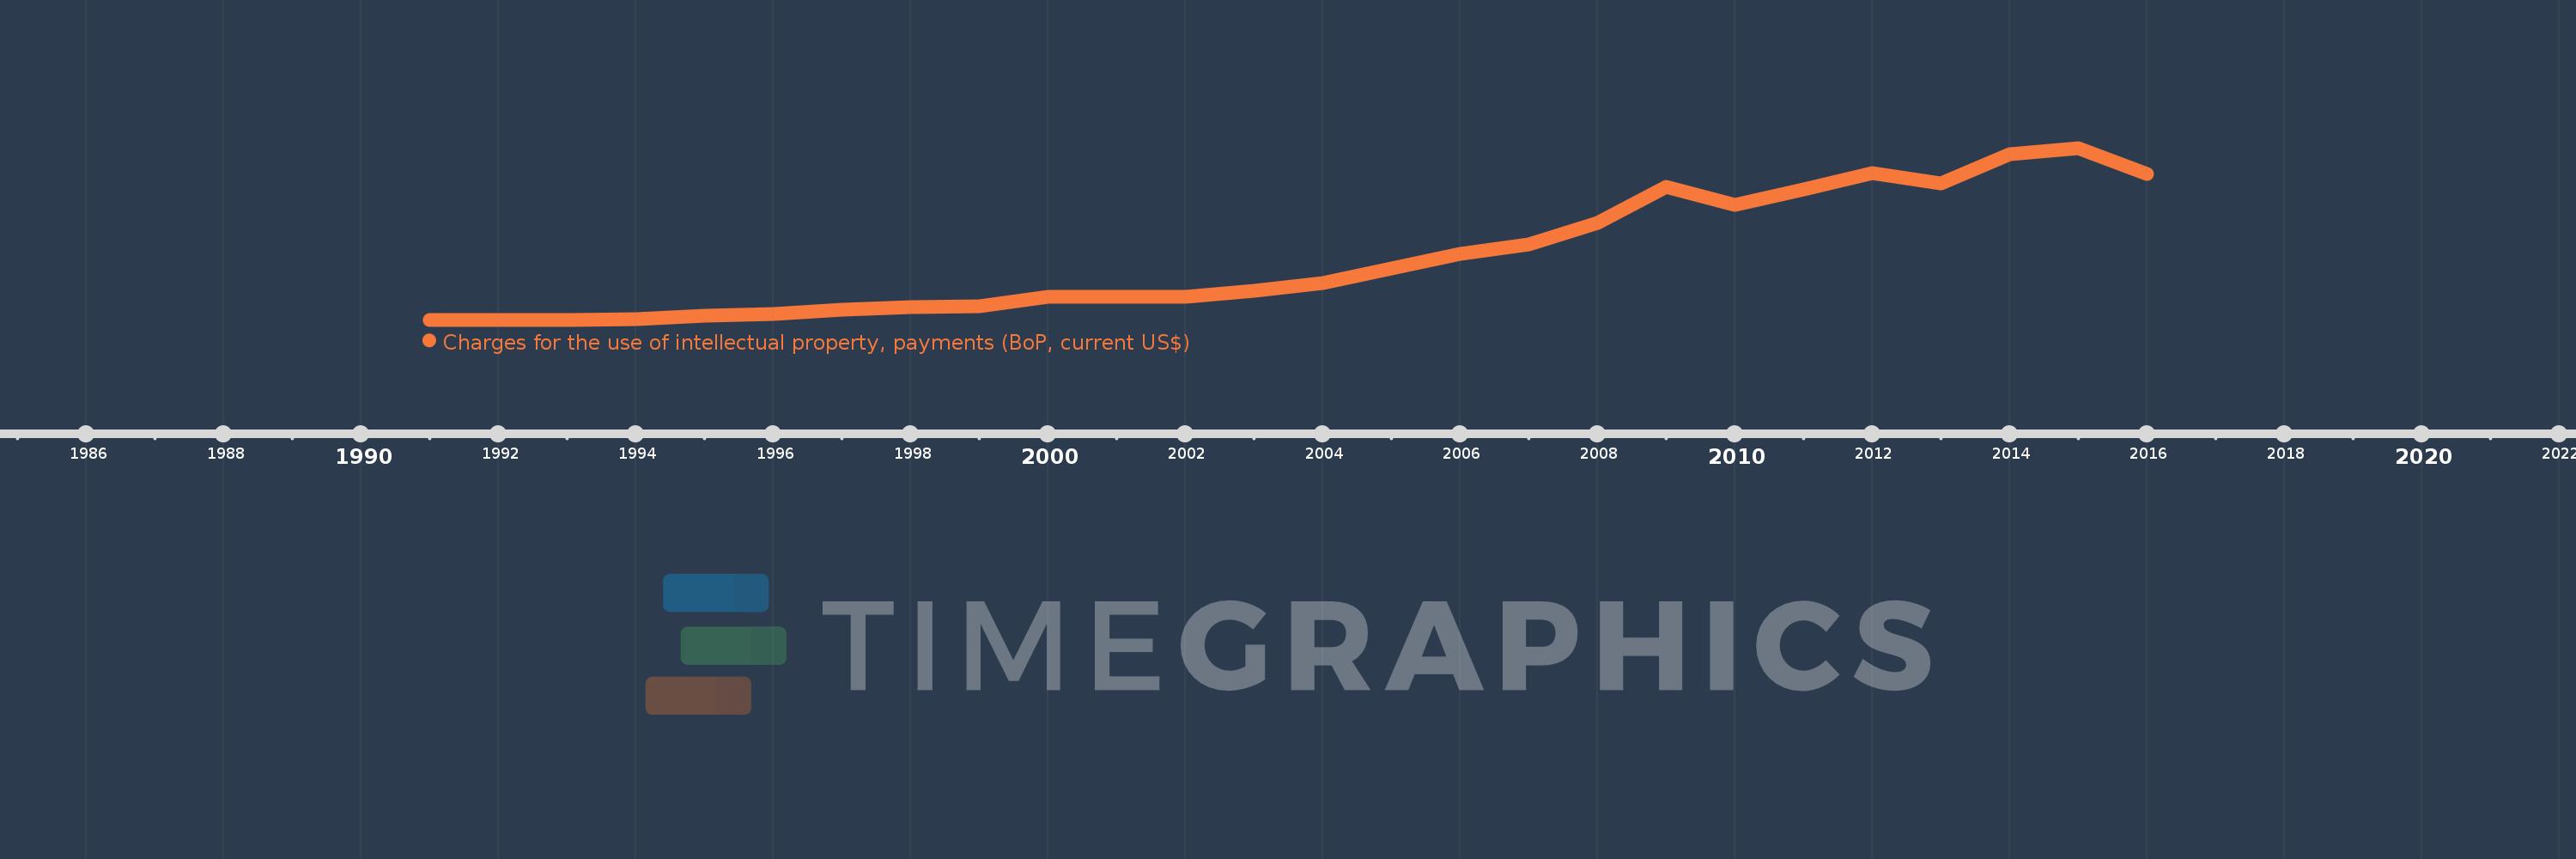
Charges for the use of intellectual property, payments (BoP, current US$)
2016,2015,2014,2013,2012,2011,2010,2009,2008,2007,2006,2005,2004,2003,2002,2001,2000,1999,1998,1997,1996,1995,1994,1993,1992,1991
This statistics in other country:
Timeline:
This timeline shows a graph from 1991 to 2016 of Central Europe and the Baltics. No data until 1990. Number of actual observations by date: 26.
Source name:
World Development Indicators
Source organization:
International Monetary Fund, Balance of Payments Statistics Yearbook and data files.
Categories, topics:
Economy & Growth, Science & Technology
Last updated:
apr 23, 2017
Indicators value changes by year
Minimum:
34.527 mln
jan 1, 1993
Maximum:
8.444 bln
jan 1, 2015
At the date of observation
Value
Absolute change
Change from previous value
jan 1, 1991
35.895 mln
+35.895 mln
0.0%
jan 1, 1992
39.068 mln
+3.173 mln
8.84%
jan 1, 1993
34.527 mln
-4.542 mln
-11.62%
jan 1, 1994
84.146 mln
+49.62 mln
143.71%
jan 1, 1995
230.705 mln
+146.558 mln
174.17%
jan 1, 1996
325.634 mln
+94.93 mln
41.15%
jan 1, 1997
536.658 mln
+211.024 mln
64.8%
jan 1, 1998
634.022 mln
+97.363 mln
18.14%
jan 1, 1999
703.397 mln
+69.375 mln
10.94%
jan 1, 2000
1.154 bln
+450.979 mln
64.11%
jan 1, 2001
1.139 bln
-15.745 mln
-1.36%
jan 1, 2002
1.144 bln
+5.689 mln
0.5%
jan 1, 2003
1.445 bln
+301.114 mln
26.31%
jan 1, 2004
1.833 bln
+387.507 mln
26.81%
jan 1, 2005
2.554 bln
+720.914 mln
39.33%
jan 1, 2006
3.252 bln
+698.399 mln
27.35%
jan 1, 2007
3.72 bln
+468.187 mln
14.4%
jan 1, 2008
4.791 bln
+1.071 bln
28.77%
jan 1, 2009
6.523 bln
+1.732 bln
36.14%
jan 1, 2010
5.642 bln
-880.993 mln
-13.51%
jan 1, 2011
6.417 bln
+775.549 mln
13.75%
jan 1, 2012
7.225 bln
+808.029 mln
12.59%
jan 1, 2013
6.702 bln
-523.281 mln
-7.24%
jan 1, 2014
8.136 bln
+1.434 bln
21.4%
jan 1, 2015
8.444 bln
+307.412 mln
3.78%
jan 1, 2016
7.153 bln
-1.29 bln
-15.28%
Ranking of countries by current statistics by years


Comments: