29
/
en
AIzaSyAYiBZKx7MnpbEhh9jyipgxe19OcubqV5w
April 1, 2024
285587
Zambia
ZMB
true
2
1
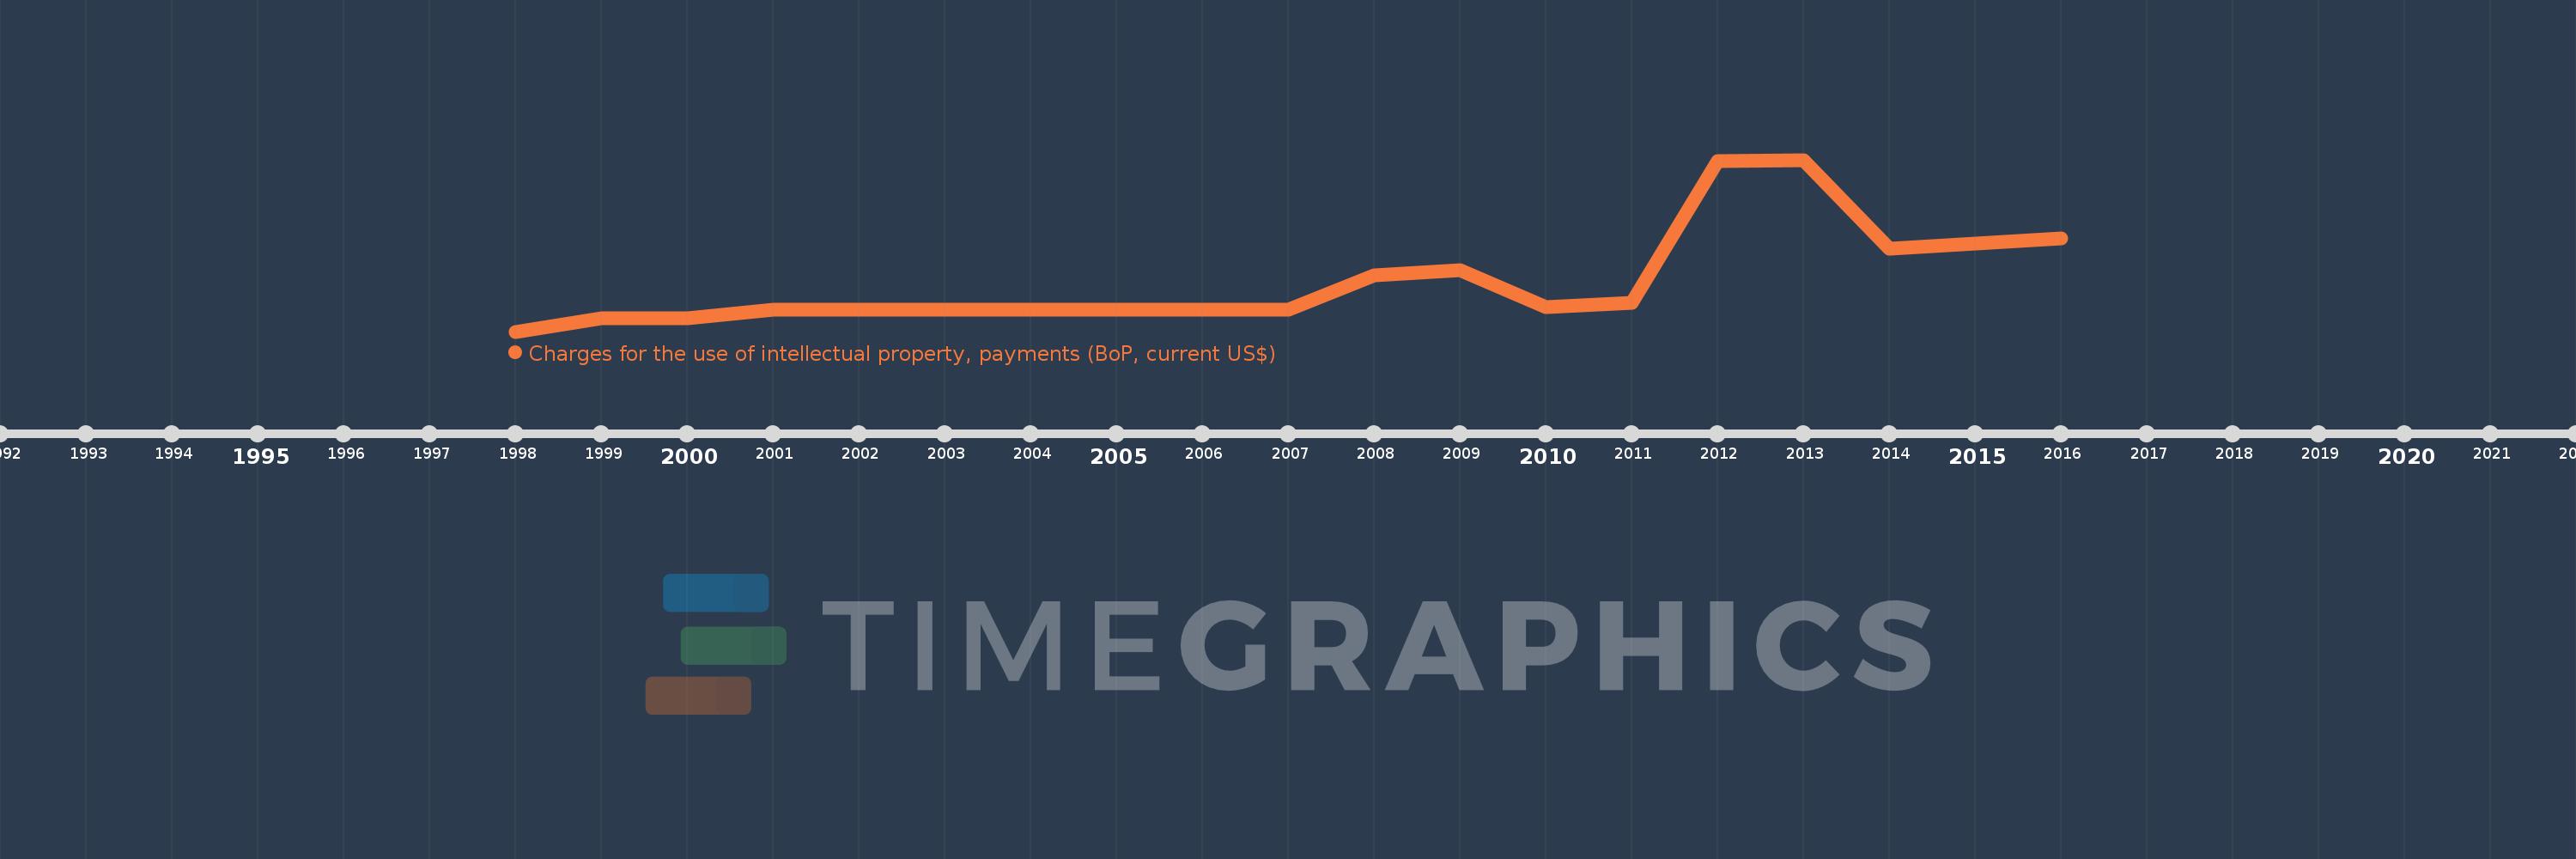
Charges for the use of intellectual property, payments (BoP, current US$)
2016,2015,2014,2013,2012,2011,2010,2009,2008,2007,2006,2004,2003,2002,2001,2000,1999,1998
This statistics in other country:
Timeline:
This timeline shows a graph from 1998 to 2016 of Zambia. No data until 1997. Number of actual observations by date: 18.
Source name:
World Development Indicators
Source organization:
International Monetary Fund, Balance of Payments Statistics Yearbook and data files.
Categories, topics:
Economy & Growth, Science & Technology
Last updated:
apr 23, 2017
Indicators value changes by year
Minimum:
-100.0K
jan 1, 1998
Maximum:
3.77 mln
jan 1, 2013
At the date of observation
Value
Absolute change
Change from previous value
jan 1, 1998
-100.0K
-100.0K
0.0%
jan 1, 1999
200.0K
+300.0K
-300.0%
jan 1, 2000
200.0K
0.0
0.0%
jan 1, 2001
400.0K
+200.0K
100.0%
jan 1, 2002
400.0K
0.0
0.0%
jan 1, 2003
400.0K
0.0
0.0%
jan 1, 2004
400.0K
0.0
0.0%
jan 1, 2006
400.0K
0.0
0.0%
jan 1, 2007
400.0K
0.0
0.0%
jan 1, 2008
1.173 mln
+772.724K
193.18%
jan 1, 2009
1.29 mln
+117.272K
10.0%
jan 1, 2010
444.4K
-845.596K
-65.55%
jan 1, 2011
548.844K
+104.444K
23.5%
jan 1, 2012
3.733 mln
+3.185 mln
580.24%
jan 1, 2013
3.77 mln
+36.766K
0.98%
jan 1, 2014
1.77 mln
-2.0 mln
-53.05%
jan 1, 2015
1.885 mln
+115.05K
6.5%
jan 1, 2016
2.008 mln
+122.528K
6.5%
Ranking of countries by current statistics by years


Comments: