29
/
en
AIzaSyAYiBZKx7MnpbEhh9jyipgxe19OcubqV5w
April 1, 2024
35578
High income
HIC
false
2
1
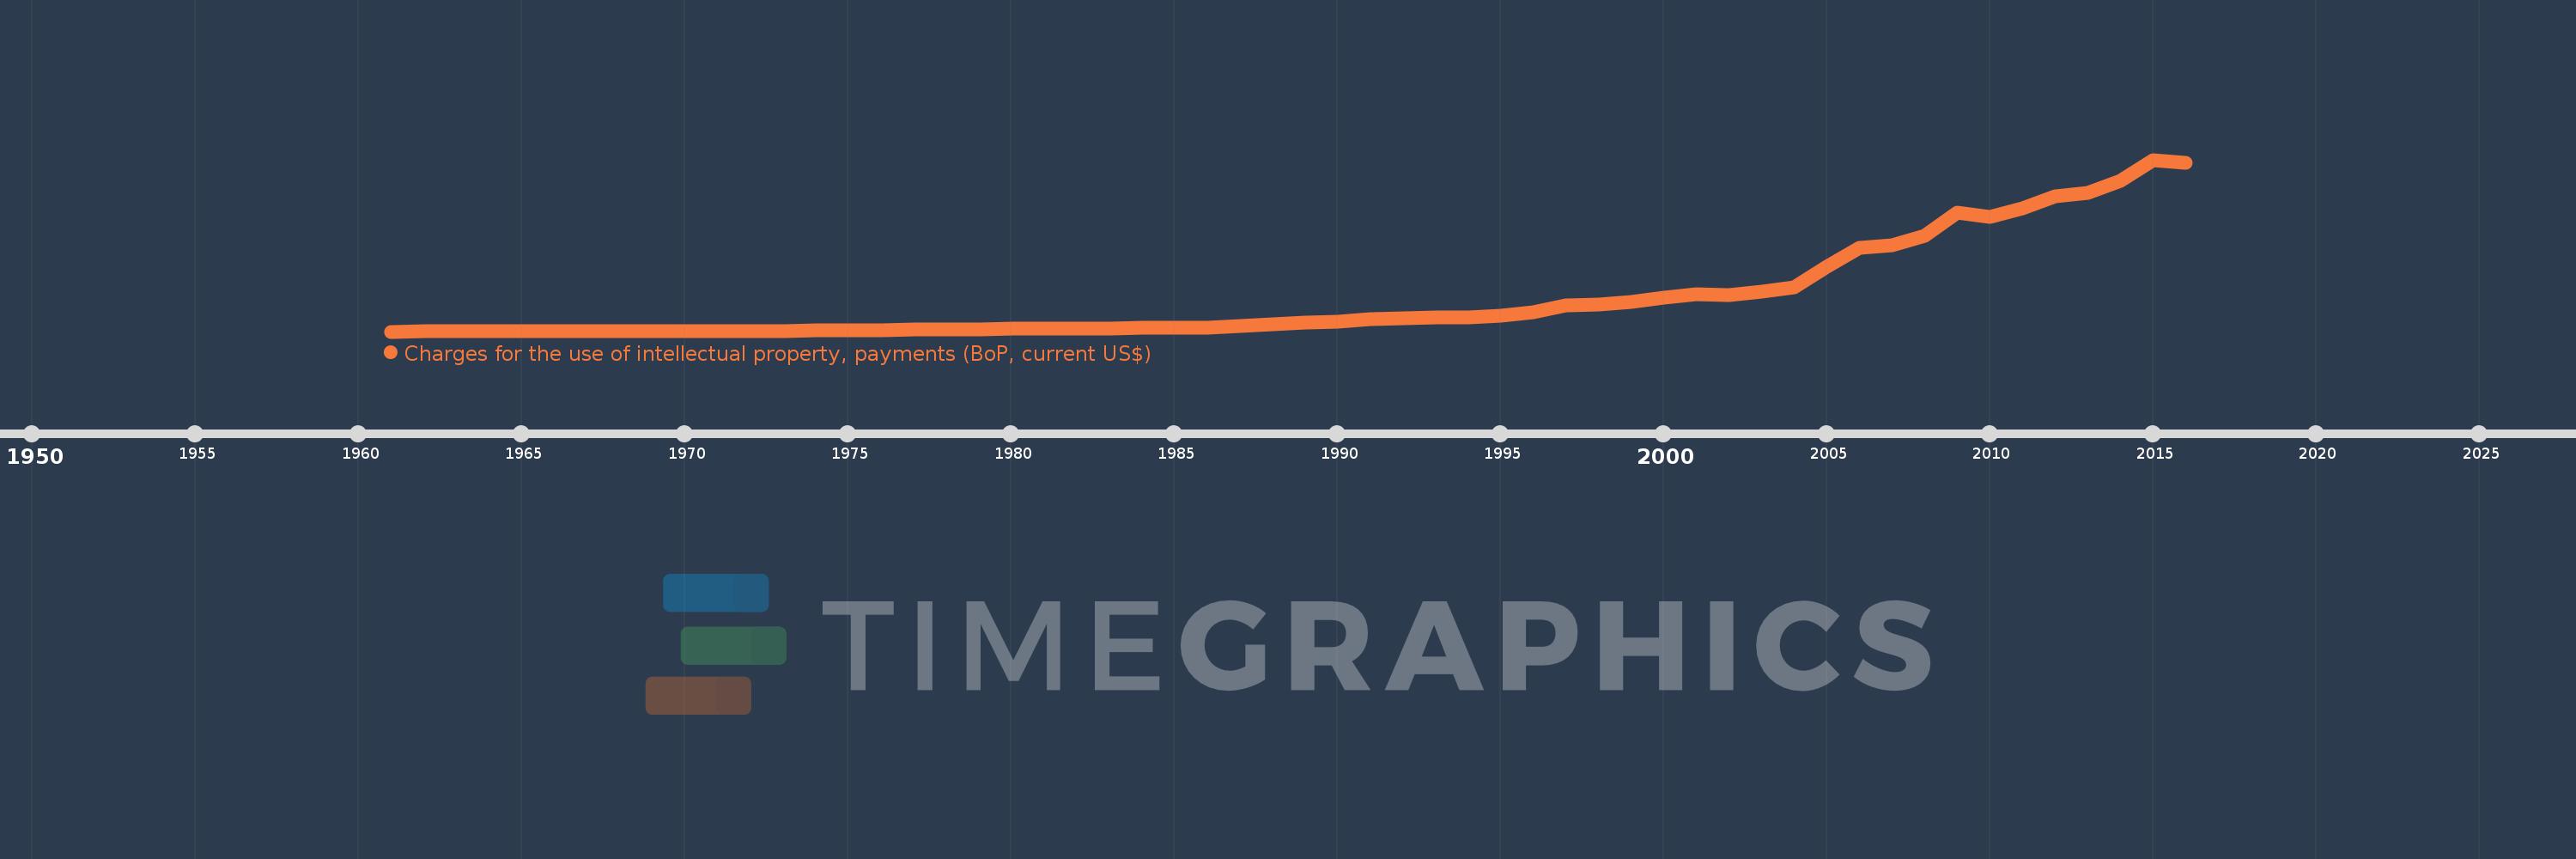
Charges for the use of intellectual property, payments (BoP, current US$)
2016,2015,2014,2013,2012,2011,2010,2009,2008,2007,2006,2005,2004,2003,2002,2001,2000,1999,1998,1997,1996,1995,1994,1993,1992,1991,1990,1989,1988,1987,1986,1985,1984,1983,1982,1981,1980,1979,1978,1977,1976,1975,1974,1973,1972,1971,1970,1969,1968,1967,1966,1962,1961
This statistics in other country:
Timeline:
This timeline shows a graph from 1961 to 2016 of High income. No data until 1960. Number of actual observations by date: 53.
Source name:
World Development Indicators
Source organization:
International Monetary Fund, Balance of Payments Statistics Yearbook and data files.
Categories, topics:
Economy & Growth, Science & Technology
Last updated:
apr 23, 2017
Indicators value changes by year
Minimum:
1000.0K
jan 1, 1961
Maximum:
307.759 bln
jan 1, 2015
At the date of observation
Value
Absolute change
Change from previous value
jan 1, 1961
1000.0K
+1000.0K
0.0%
jan 1, 1962
2.0 mln
+1000.0K
100.0%
jan 1, 1966
2.0 mln
0.0
0.0%
jan 1, 1967
2.0 mln
0.0
0.0%
jan 1, 1968
67.193 mln
+65.193 mln
3.26K%
jan 1, 1969
76.481 mln
+9.287 mln
13.82%
jan 1, 1970
104.934 mln
+28.453 mln
37.2%
jan 1, 1971
675.453 mln
+570.519 mln
543.69%
jan 1, 1972
1.147 bln
+471.668 mln
69.83%
jan 1, 1973
1.374 bln
+226.925 mln
19.78%
jan 1, 1974
1.705 bln
+330.568 mln
24.06%
jan 1, 1975
1.87 bln
+165.163 mln
9.69%
jan 1, 1976
3.061 bln
+1.192 bln
63.73%
jan 1, 1977
3.255 bln
+194.084 mln
6.34%
jan 1, 1978
3.475 bln
+219.577 mln
6.75%
jan 1, 1979
4.185 bln
+710.392 mln
20.44%
jan 1, 1980
5.318 bln
+1.132 bln
27.05%
jan 1, 1981
6.001 bln
+683.459 mln
12.85%
jan 1, 1982
6.036 bln
+34.793 mln
0.58%
jan 1, 1983
6.141 bln
+104.63 mln
1.73%
jan 1, 1984
6.404 bln
+263.003 mln
4.28%
jan 1, 1985
6.813 bln
+409.148 mln
6.39%
jan 1, 1986
7.184 bln
+371.682 mln
5.46%
jan 1, 1987
9.429 bln
+2.244 bln
31.24%
jan 1, 1988
12.474 bln
+3.046 bln
32.31%
jan 1, 1989
15.57 bln
+3.096 bln
24.82%
jan 1, 1990
17.379 bln
+1.808 bln
11.61%
jan 1, 1991
22.249 bln
+4.87 bln
28.03%
jan 1, 1992
23.594 bln
+1.345 bln
6.05%
jan 1, 1993
25.491 bln
+1.897 bln
8.04%
jan 1, 1994
24.932 bln
-558.658 mln
-2.19%
jan 1, 1995
27.932 bln
+3.0 bln
12.03%
jan 1, 1996
34.767 bln
+6.835 bln
24.47%
jan 1, 1997
47.352 bln
+12.585 bln
36.2%
jan 1, 1998
48.758 bln
+1.406 bln
2.97%
jan 1, 1999
52.358 bln
+3.6 bln
7.38%
jan 1, 2000
60.755 bln
+8.397 bln
16.04%
jan 1, 2001
66.437 bln
+5.683 bln
9.35%
jan 1, 2002
65.745 bln
-691.874 mln
-1.04%
jan 1, 2003
71.472 bln
+5.727 bln
8.71%
jan 1, 2004
79.794 bln
+8.322 bln
11.64%
jan 1, 2005
116.324 bln
+36.53 bln
45.78%
jan 1, 2006
149.308 bln
+32.984 bln
28.36%
jan 1, 2007
155.398 bln
+6.09 bln
4.08%
jan 1, 2008
171.617 bln
+16.219 bln
10.44%
jan 1, 2009
212.975 bln
+41.358 bln
24.1%
jan 1, 2010
206.08 bln
-6.895 bln
-3.24%
jan 1, 2011
221.531 bln
+15.45 bln
7.5%
jan 1, 2012
242.856 bln
+21.325 bln
9.63%
jan 1, 2013
248.162 bln
+5.305 bln
2.18%
jan 1, 2014
269.894 bln
+21.732 bln
8.76%
jan 1, 2015
307.759 bln
+37.865 bln
14.03%
jan 1, 2016
301.917 bln
-5.842 bln
-1.9%
Ranking of countries by current statistics by years


Comments: