29
/
en
AIzaSyAYiBZKx7MnpbEhh9jyipgxe19OcubqV5w
April 1, 2024
45906
Low income
LIC
false
2
1
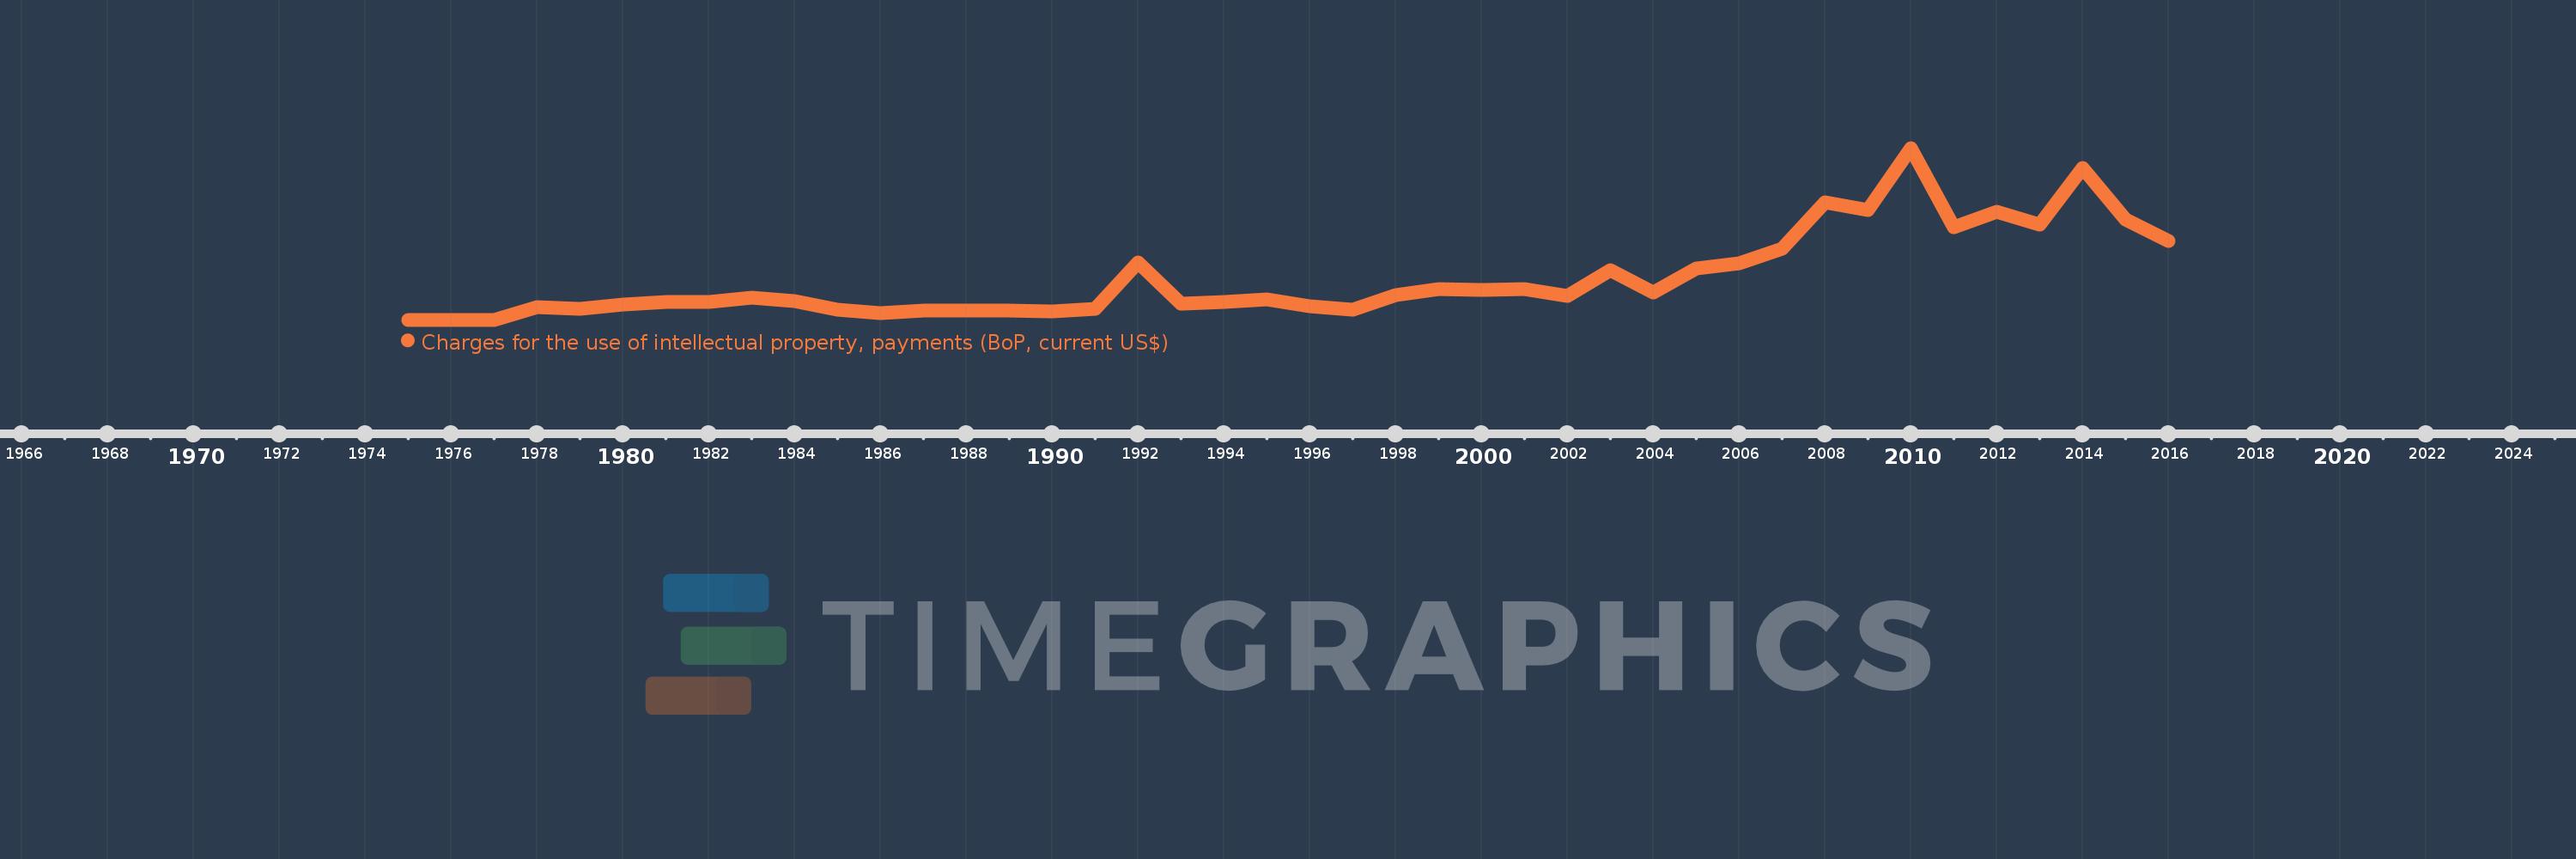
Charges for the use of intellectual property, payments (BoP, current US$)
2016,2015,2014,2013,2012,2011,2010,2009,2008,2007,2006,2005,2004,2003,2002,2001,2000,1999,1998,1997,1996,1995,1994,1993,1992,1991,1990,1989,1988,1987,1986,1985,1984,1983,1982,1981,1980,1979,1978,1977,1976,1975
This statistics in other country:
Timeline:
This timeline shows a graph from 1975 to 2016 of Low income. No data until 1974. Number of actual observations by date: 42.
Source name:
World Development Indicators
Source organization:
International Monetary Fund, Balance of Payments Statistics Yearbook and data files.
Categories, topics:
Economy & Growth, Science & Technology
Last updated:
apr 23, 2017
Indicators value changes by year
Minimum:
124.634K
jan 1, 1975
Maximum:
133.387 mln
jan 1, 2010
At the date of observation
Value
Absolute change
Change from previous value
jan 1, 1975
124.634K
+124.634K
0.0%
jan 1, 1976
139.982K
+15.348K
12.31%
jan 1, 1977
197.705K
+57.723K
41.24%
jan 1, 1978
10.129 mln
+9.931 mln
5.02K%
jan 1, 1979
8.757 mln
-1.372 mln
-13.54%
jan 1, 1980
11.99 mln
+3.233 mln
36.92%
jan 1, 1981
13.921 mln
+1.931 mln
16.1%
jan 1, 1982
14.191 mln
+269.405K
1.94%
jan 1, 1983
17.435 mln
+3.245 mln
22.87%
jan 1, 1984
14.308 mln
-3.127 mln
-17.93%
jan 1, 1985
7.973 mln
-6.335 mln
-44.27%
jan 1, 1986
5.127 mln
-2.846 mln
-35.7%
jan 1, 1987
7.182 mln
+2.055 mln
40.08%
jan 1, 1988
7.461 mln
+278.492K
3.88%
jan 1, 1989
7.138 mln
-322.708K
-4.33%
jan 1, 1990
6.576 mln
-561.585K
-7.87%
jan 1, 1991
8.887 mln
+2.311 mln
35.14%
jan 1, 1992
44.245 mln
+35.358 mln
397.86%
jan 1, 1993
12.43 mln
-31.815 mln
-71.91%
jan 1, 1994
13.715 mln
+1.285 mln
10.34%
jan 1, 1995
16.112 mln
+2.397 mln
17.48%
jan 1, 1996
10.374 mln
-5.738 mln
-35.61%
jan 1, 1997
7.855 mln
-2.519 mln
-24.28%
jan 1, 1998
19.421 mln
+11.566 mln
147.25%
jan 1, 1999
23.862 mln
+4.441 mln
22.86%
jan 1, 2000
23.354 mln
-507.549K
-2.13%
jan 1, 2001
23.945 mln
+590.848K
2.53%
jan 1, 2002
18.847 mln
-5.098 mln
-21.29%
jan 1, 2003
38.518 mln
+19.671 mln
104.37%
jan 1, 2004
21.314 mln
-17.204 mln
-44.67%
jan 1, 2005
39.808 mln
+18.494 mln
86.77%
jan 1, 2006
43.898 mln
+4.09 mln
10.27%
jan 1, 2007
55.361 mln
+11.463 mln
26.11%
jan 1, 2008
91.458 mln
+36.098 mln
65.21%
jan 1, 2009
85.361 mln
-6.098 mln
-6.67%
jan 1, 2010
133.387 mln
+48.026 mln
56.26%
jan 1, 2011
71.872 mln
-61.515 mln
-46.12%
jan 1, 2012
83.922 mln
+12.05 mln
16.77%
jan 1, 2013
73.912 mln
-10.01 mln
-11.93%
jan 1, 2014
117.702 mln
+43.79 mln
59.25%
jan 1, 2015
77.766 mln
-39.936 mln
-33.93%
jan 1, 2016
61.031 mln
-16.735 mln
-21.52%
Ranking of countries by current statistics by years


Comments: