29
/
en
AIzaSyAYiBZKx7MnpbEhh9jyipgxe19OcubqV5w
April 1, 2024
250535
St. Lucia
LCA
true
2
1
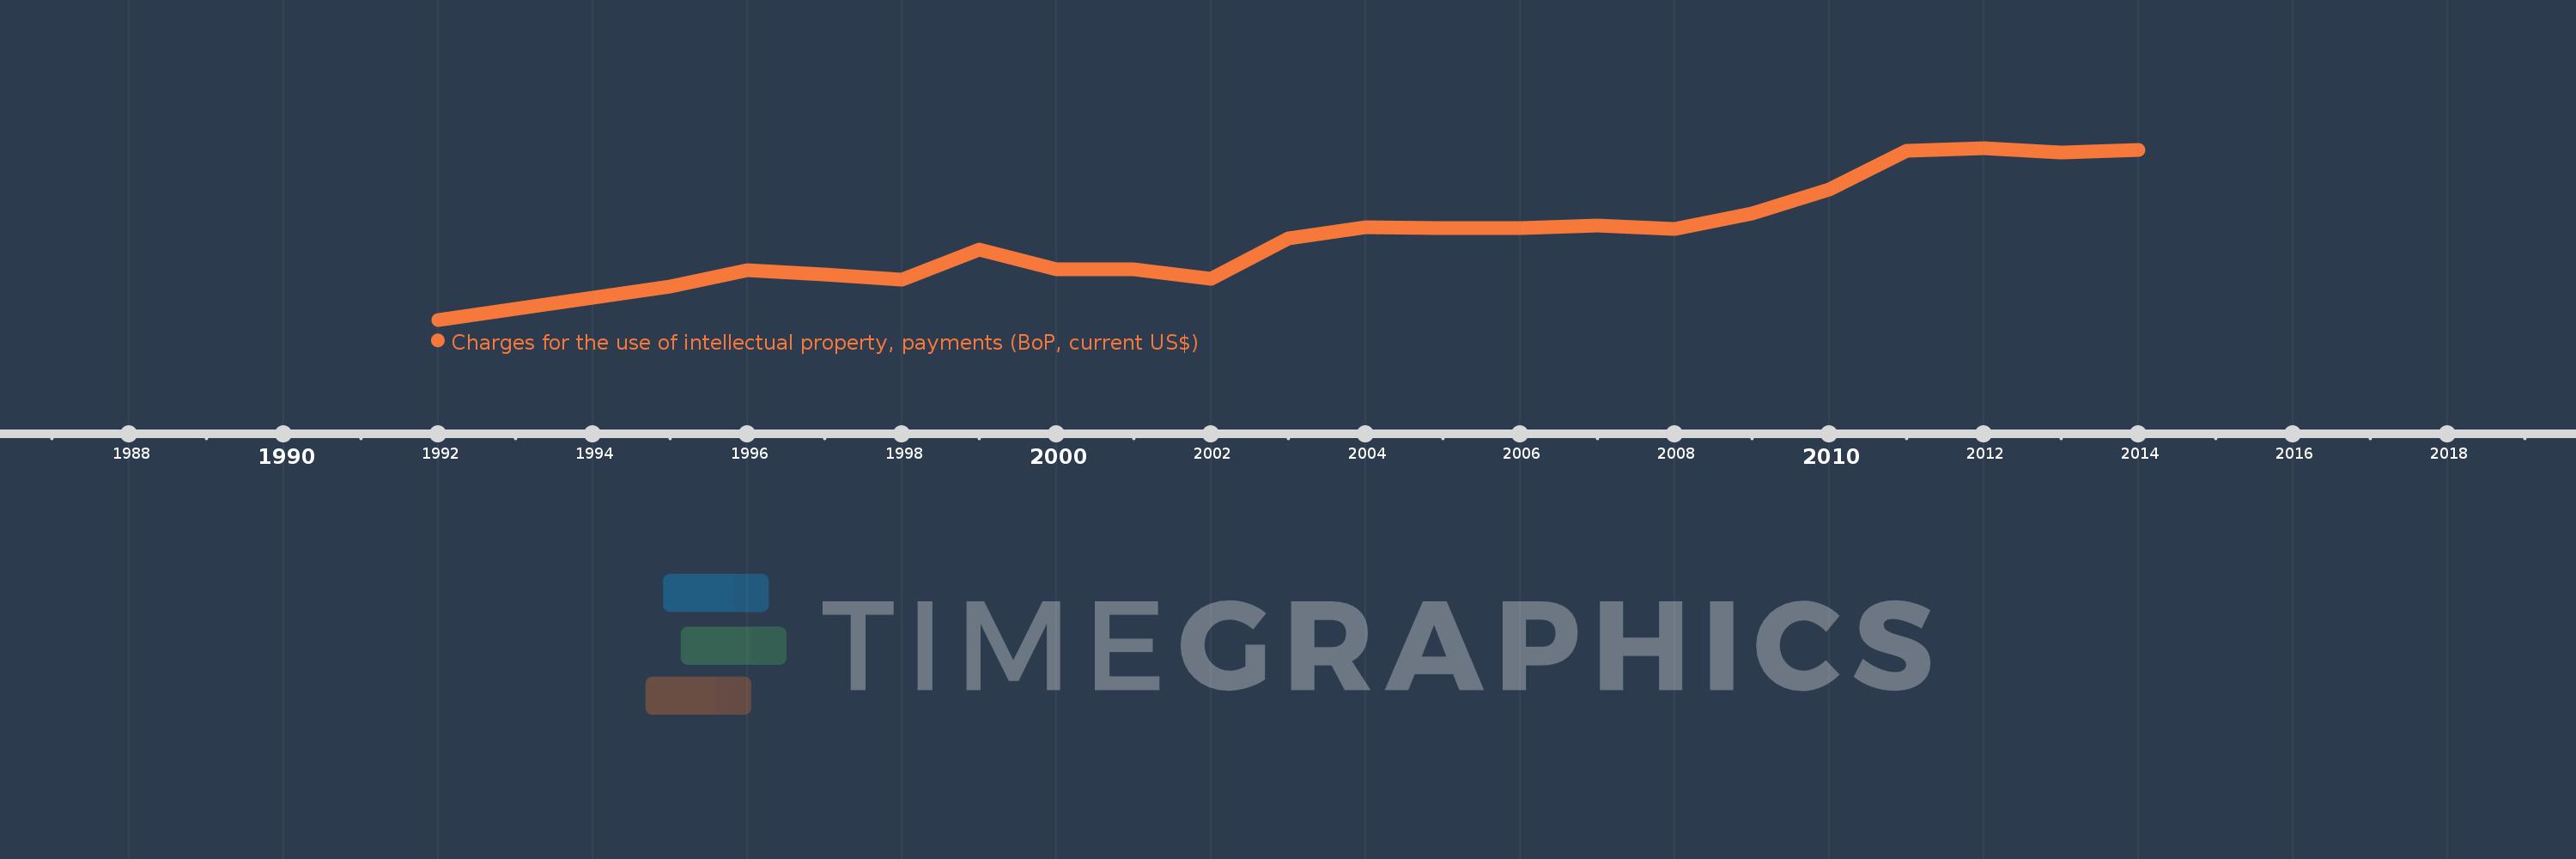
Charges for the use of intellectual property, payments (BoP, current US$)
2014,2013,2012,2011,2010,2009,2008,2007,2006,2005,2004,2003,2002,2001,2000,1999,1998,1997,1996,1995,1992
This statistics in other country:
Timeline:
This timeline shows a graph from 1992 to 2014 of St. Lucia. No data until 1991. Number of actual observations by date: 21.
Source name:
World Development Indicators
Source organization:
International Monetary Fund, Balance of Payments Statistics Yearbook and data files.
Categories, topics:
Economy & Growth, Science & Technology
Last updated:
apr 23, 2017
Indicators value changes by year
Minimum:
566.667K
jan 1, 1992
Maximum:
3.983 mln
jan 1, 2012
At the date of observation
Value
Absolute change
Change from previous value
jan 1, 1992
566.667K
+566.667K
0.0%
jan 1, 1995
1.222 mln
+655.556K
115.69%
jan 1, 1996
1.559 mln
+337.037K
27.58%
jan 1, 1997
1.463 mln
-96.296K
-6.18%
jan 1, 1998
1.37 mln
-92.593K
-6.33%
jan 1, 1999
1.959 mln
+588.889K
42.97%
jan 1, 2000
1.57 mln
-388.889K
-19.85%
jan 1, 2001
1.57 mln
0.0
0.0%
jan 1, 2002
1.378 mln
-192.593K
-12.26%
jan 1, 2003
2.178 mln
+800.0K
58.06%
jan 1, 2004
2.404 mln
+225.926K
10.37%
jan 1, 2005
2.381 mln
-22.593K
-0.94%
jan 1, 2006
2.381 mln
+359.259
0.02%
jan 1, 2007
2.433 mln
+51.122K
2.15%
jan 1, 2008
2.374 mln
-58.933K
-2.42%
jan 1, 2009
2.681 mln
+307.537K
12.96%
jan 1, 2010
3.156 mln
+474.874K
17.71%
jan 1, 2011
3.928 mln
+771.823K
24.46%
jan 1, 2012
3.983 mln
+55.275K
1.41%
jan 1, 2013
3.9 mln
-83.006K
-2.08%
jan 1, 2014
3.941 mln
+40.484K
1.04%
Ranking of countries by current statistics by years


Comments: