29
/
en
AIzaSyAYiBZKx7MnpbEhh9jyipgxe19OcubqV5w
April 1, 2024
167180
Kenya
KEN
true
2
1
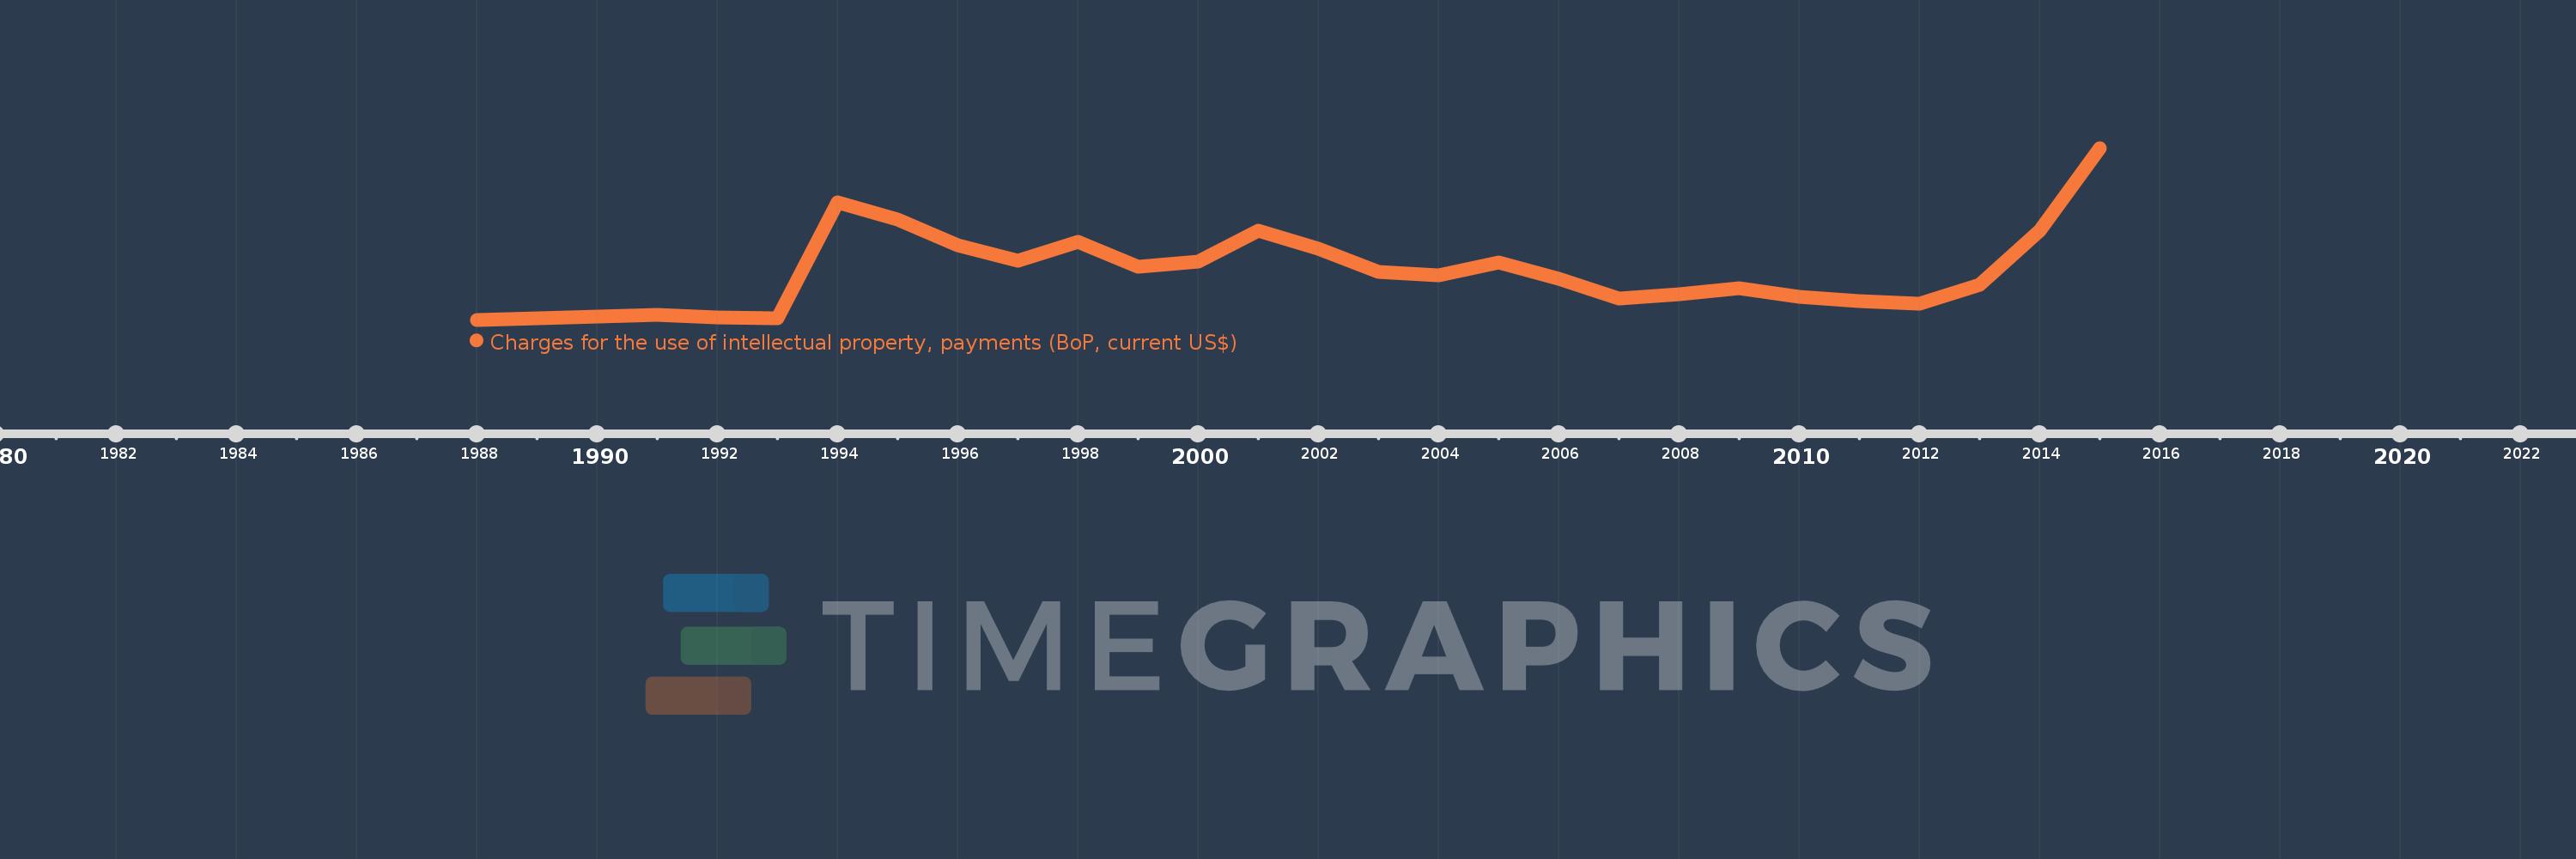
Charges for the use of intellectual property, payments (BoP, current US$)
2015,2014,2013,2012,2011,2010,2009,2008,2007,2006,2005,2004,2003,2002,2001,2000,1999,1998,1997,1996,1995,1994,1993,1992,1991,1990,1988
This statistics in other country:
Timeline:
This timeline shows a graph from 1988 to 2015 of Kenya. No data until 1987. Number of actual observations by date: 27.
Source name:
World Development Indicators
Source organization:
International Monetary Fund, Balance of Payments Statistics Yearbook and data files.
Categories, topics:
Economy & Growth, Science & Technology
Last updated:
apr 23, 2017
Indicators value changes by year
Minimum:
1.823 mln
jan 1, 1988
Maximum:
147.499 mln
jan 1, 2015
At the date of observation
Value
Absolute change
Change from previous value
jan 1, 1988
1.823 mln
+1.823 mln
0.0%
jan 1, 1990
4.229 mln
+2.406 mln
131.95%
jan 1, 1991
5.979 mln
+1.75 mln
41.37%
jan 1, 1992
3.846 mln
-2.133 mln
-35.67%
jan 1, 1993
3.352 mln
-493.888K
-12.84%
jan 1, 1994
101.528 mln
+98.176 mln
2.93K%
jan 1, 1995
87.13 mln
-14.398 mln
-14.18%
jan 1, 1996
64.943 mln
-22.187 mln
-25.46%
jan 1, 1997
52.106 mln
-12.837 mln
-19.77%
jan 1, 1998
67.871 mln
+15.764 mln
30.25%
jan 1, 1999
46.834 mln
-21.036 mln
-30.99%
jan 1, 2000
50.827 mln
+3.992 mln
8.52%
jan 1, 2001
77.305 mln
+26.479 mln
52.1%
jan 1, 2002
62.163 mln
-15.143 mln
-19.59%
jan 1, 2003
42.413 mln
-19.749 mln
-31.77%
jan 1, 2004
39.192 mln
-3.222 mln
-7.6%
jan 1, 2005
50.347 mln
+11.155 mln
28.46%
jan 1, 2006
36.9 mln
-13.447 mln
-26.71%
jan 1, 2007
19.722 mln
-17.178 mln
-46.55%
jan 1, 2008
23.566 mln
+3.844 mln
19.49%
jan 1, 2009
28.437 mln
+4.871 mln
20.67%
jan 1, 2010
21.238 mln
-7.199 mln
-25.32%
jan 1, 2011
17.805 mln
-3.434 mln
-16.17%
jan 1, 2012
15.093 mln
-2.712 mln
-15.23%
jan 1, 2013
31.782 mln
+16.689 mln
110.57%
jan 1, 2014
77.529 mln
+45.747 mln
143.94%
jan 1, 2015
147.499 mln
+69.97 mln
90.25%
Ranking of countries by current statistics by years


Comments: