29
/
en
AIzaSyAYiBZKx7MnpbEhh9jyipgxe19OcubqV5w
April 1, 2024
130157
Ethiopia
ETH
true
2
1
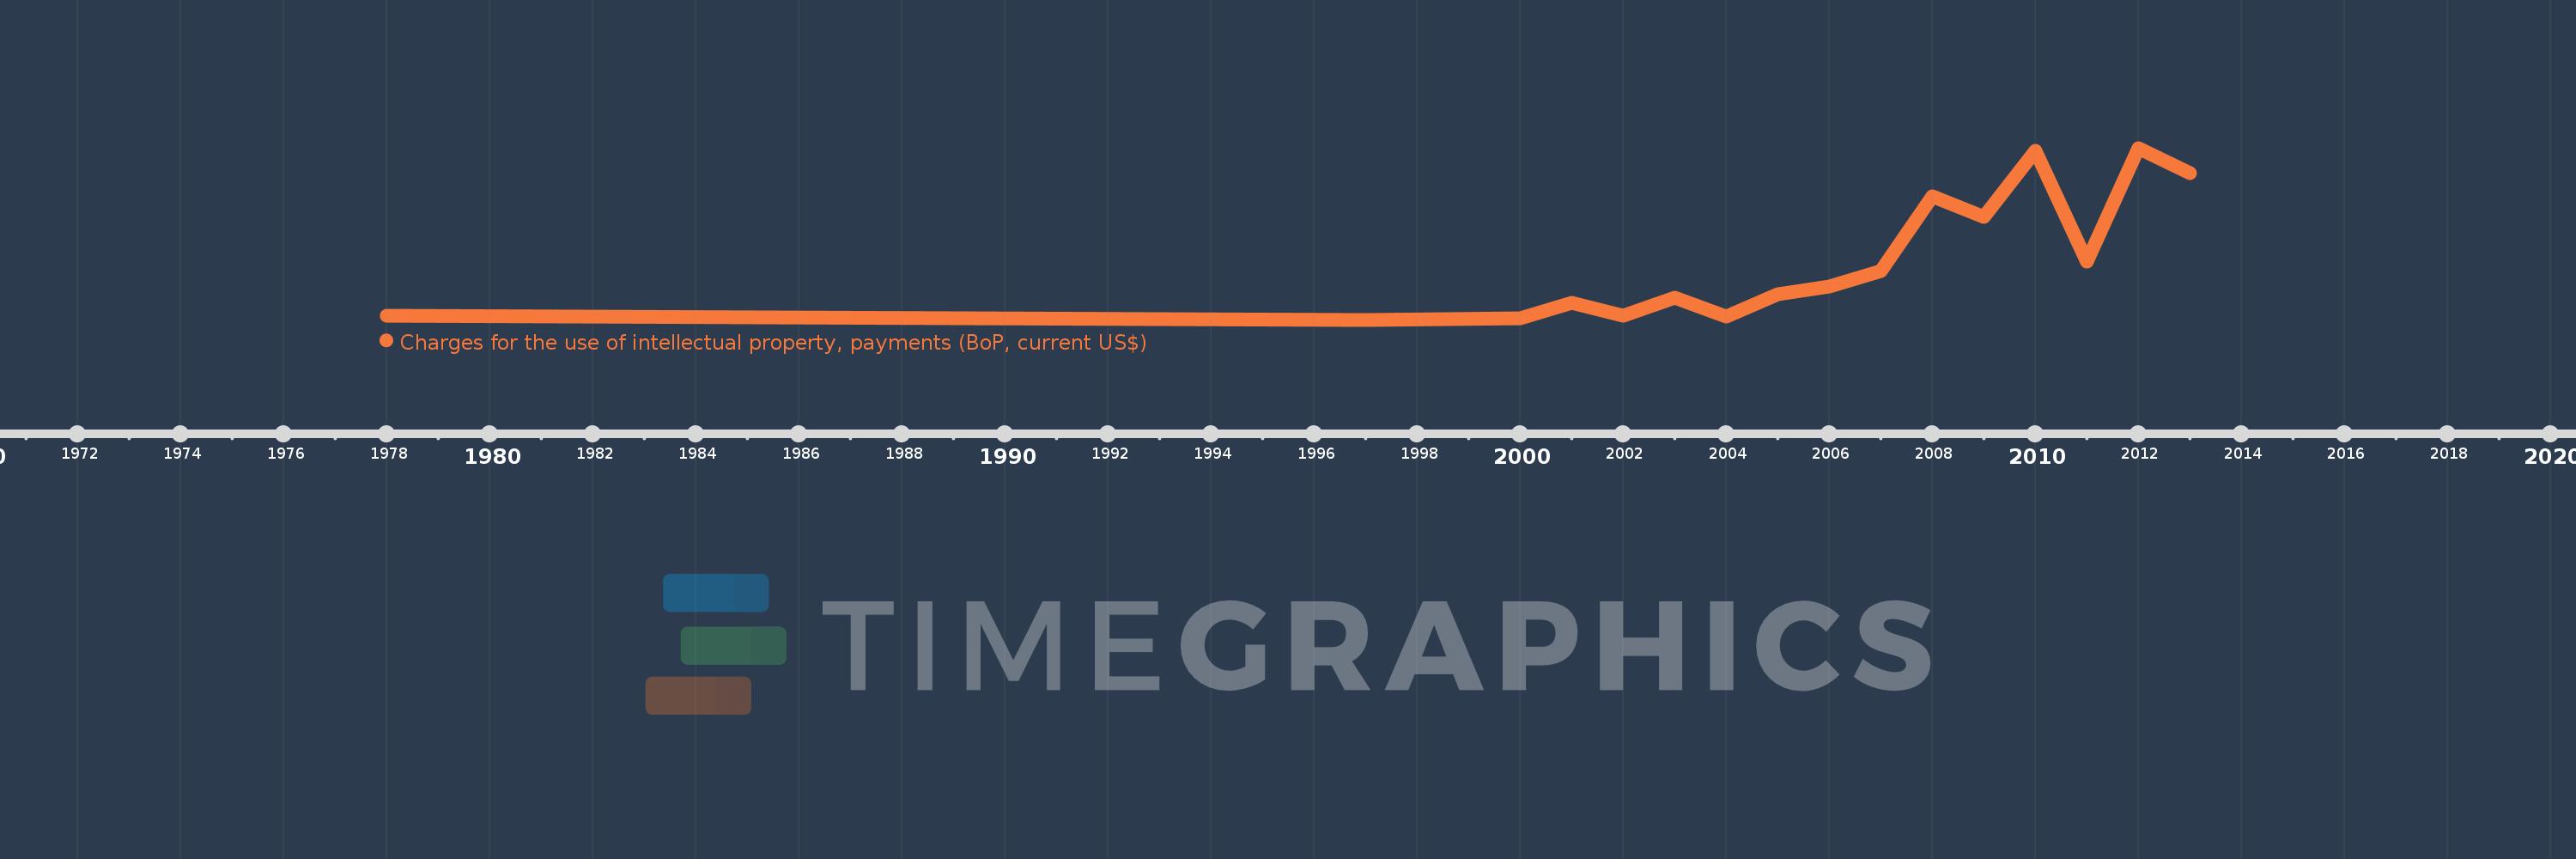
Charges for the use of intellectual property, payments (BoP, current US$)
2013,2012,2011,2010,2009,2008,2007,2006,2005,2004,2003,2002,2001,2000,1997,1978
This statistics in other country:
Timeline:
This timeline shows a graph from 1978 to 2013 of Ethiopia. No data until 1977. Number of actual observations by date: 16.
Source name:
World Development Indicators
Source organization:
International Monetary Fund, Balance of Payments Statistics Yearbook and data files.
Categories, topics:
Economy & Growth, Science & Technology
Last updated:
apr 23, 2017
Indicators value changes by year
Minimum:
31.518K
jan 1, 1997
Maximum:
2.877 mln
jan 1, 2012
At the date of observation
Value
Absolute change
Change from previous value
jan 1, 1978
96.618K
+96.618K
0.0%
jan 1, 1997
31.518K
-65.1K
-67.38%
jan 1, 2000
52.684K
+21.165K
67.15%
jan 1, 2001
316.615K
+263.931K
500.97%
jan 1, 2002
101.147K
-215.468K
-68.05%
jan 1, 2003
396.118K
+294.971K
291.63%
jan 1, 2004
88.288K
-307.829K
-77.71%
jan 1, 2005
450.079K
+361.791K
409.78%
jan 1, 2006
575.608K
+125.529K
27.89%
jan 1, 2007
844.549K
+268.941K
46.72%
jan 1, 2008
2.071 mln
+1.226 mln
145.17%
jan 1, 2009
1.729 mln
-341.76K
-16.51%
jan 1, 2010
2.826 mln
+1.097 mln
63.47%
jan 1, 2011
993.167K
-1.833 mln
-64.86%
jan 1, 2012
2.877 mln
+1.884 mln
189.71%
jan 1, 2013
2.458 mln
-418.83K
-14.56%
Ranking of countries by current statistics by years


Comments: