29
/
en
AIzaSyAYiBZKx7MnpbEhh9jyipgxe19OcubqV5w
April 1, 2024
241373
Slovak Republic
SVK
true
2
1
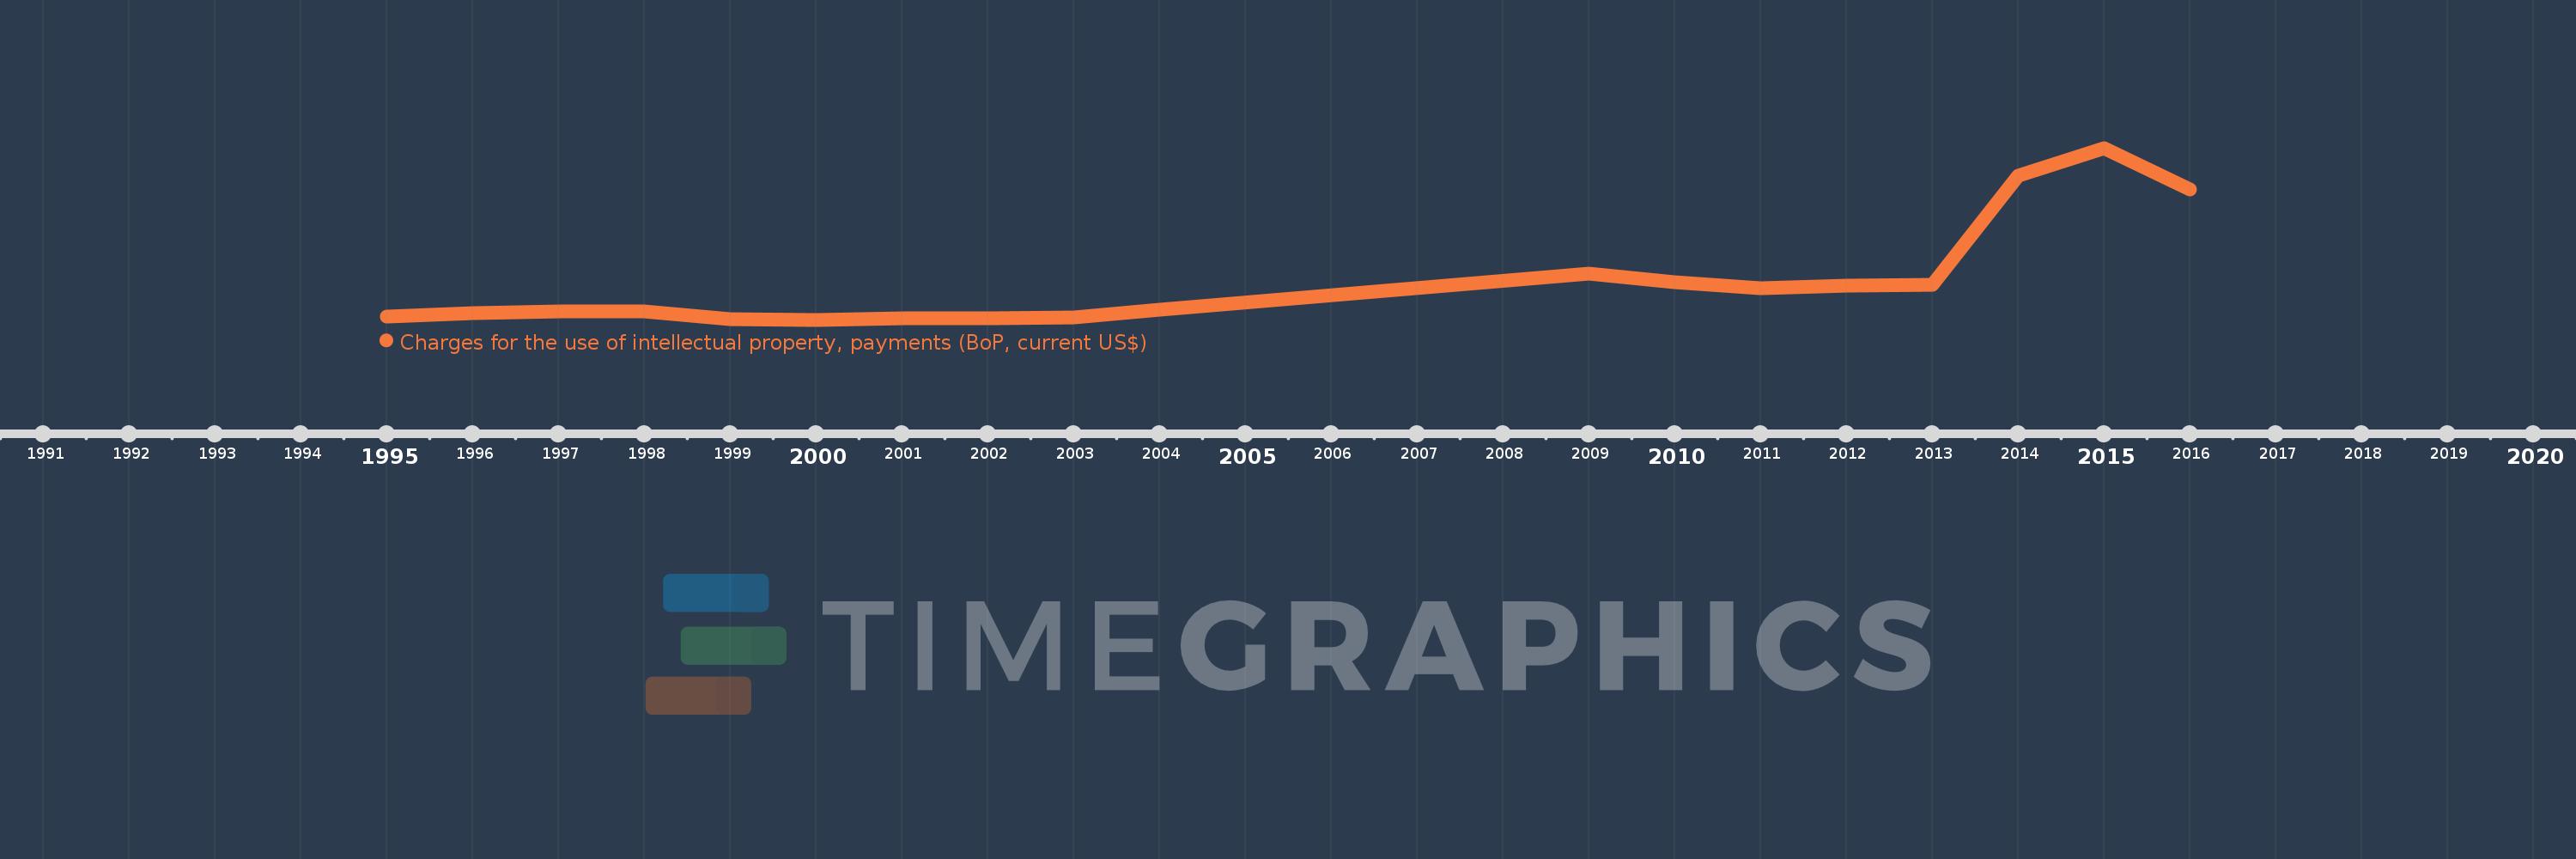
Charges for the use of intellectual property, payments (BoP, current US$)
2016,2015,2014,2013,2012,2011,2010,2009,2004,2003,2002,2001,2000,1999,1998,1997,1996,1995
This statistics in other country:
Timeline:
This timeline shows a graph from 1995 to 2016 of Slovak Republic. No data until 1994. Number of actual observations by date: 18.
Source name:
World Development Indicators
Source organization:
International Monetary Fund, Balance of Payments Statistics Yearbook and data files.
Categories, topics:
Economy & Growth, Science & Technology
Last updated:
apr 23, 2017
Indicators value changes by year
Minimum:
53.938 mln
jan 1, 2000
Maximum:
672.084 mln
jan 1, 2015
At the date of observation
Value
Absolute change
Change from previous value
jan 1, 1995
64.181 mln
+64.181 mln
0.0%
jan 1, 1996
78.966 mln
+14.784 mln
23.04%
jan 1, 1997
82.547 mln
+3.582 mln
4.54%
jan 1, 1998
85.453 mln
+2.906 mln
3.52%
jan 1, 1999
54.617 mln
-30.836 mln
-36.09%
jan 1, 2000
53.938 mln
-678.972K
-1.24%
jan 1, 2001
58.131 mln
+4.192 mln
7.77%
jan 1, 2002
58.407 mln
+276.407K
0.48%
jan 1, 2003
63.194 mln
+4.787 mln
8.2%
jan 1, 2004
91.221 mln
+28.027 mln
44.35%
jan 1, 2009
220.304 mln
+129.083 mln
141.51%
jan 1, 2010
189.813 mln
-30.491 mln
-13.84%
jan 1, 2011
168.404 mln
-21.409 mln
-11.28%
jan 1, 2012
176.419 mln
+8.015 mln
4.76%
jan 1, 2013
181.043 mln
+4.624 mln
2.62%
jan 1, 2014
571.874 mln
+390.831 mln
215.88%
jan 1, 2015
672.084 mln
+100.21 mln
17.52%
jan 1, 2016
521.978 mln
-150.106 mln
-22.33%
Ranking of countries by current statistics by years


Comments: