29
/
en
AIzaSyAYiBZKx7MnpbEhh9jyipgxe19OcubqV5w
April 1, 2024
117680
Czech Republic
CZE
true
2
1
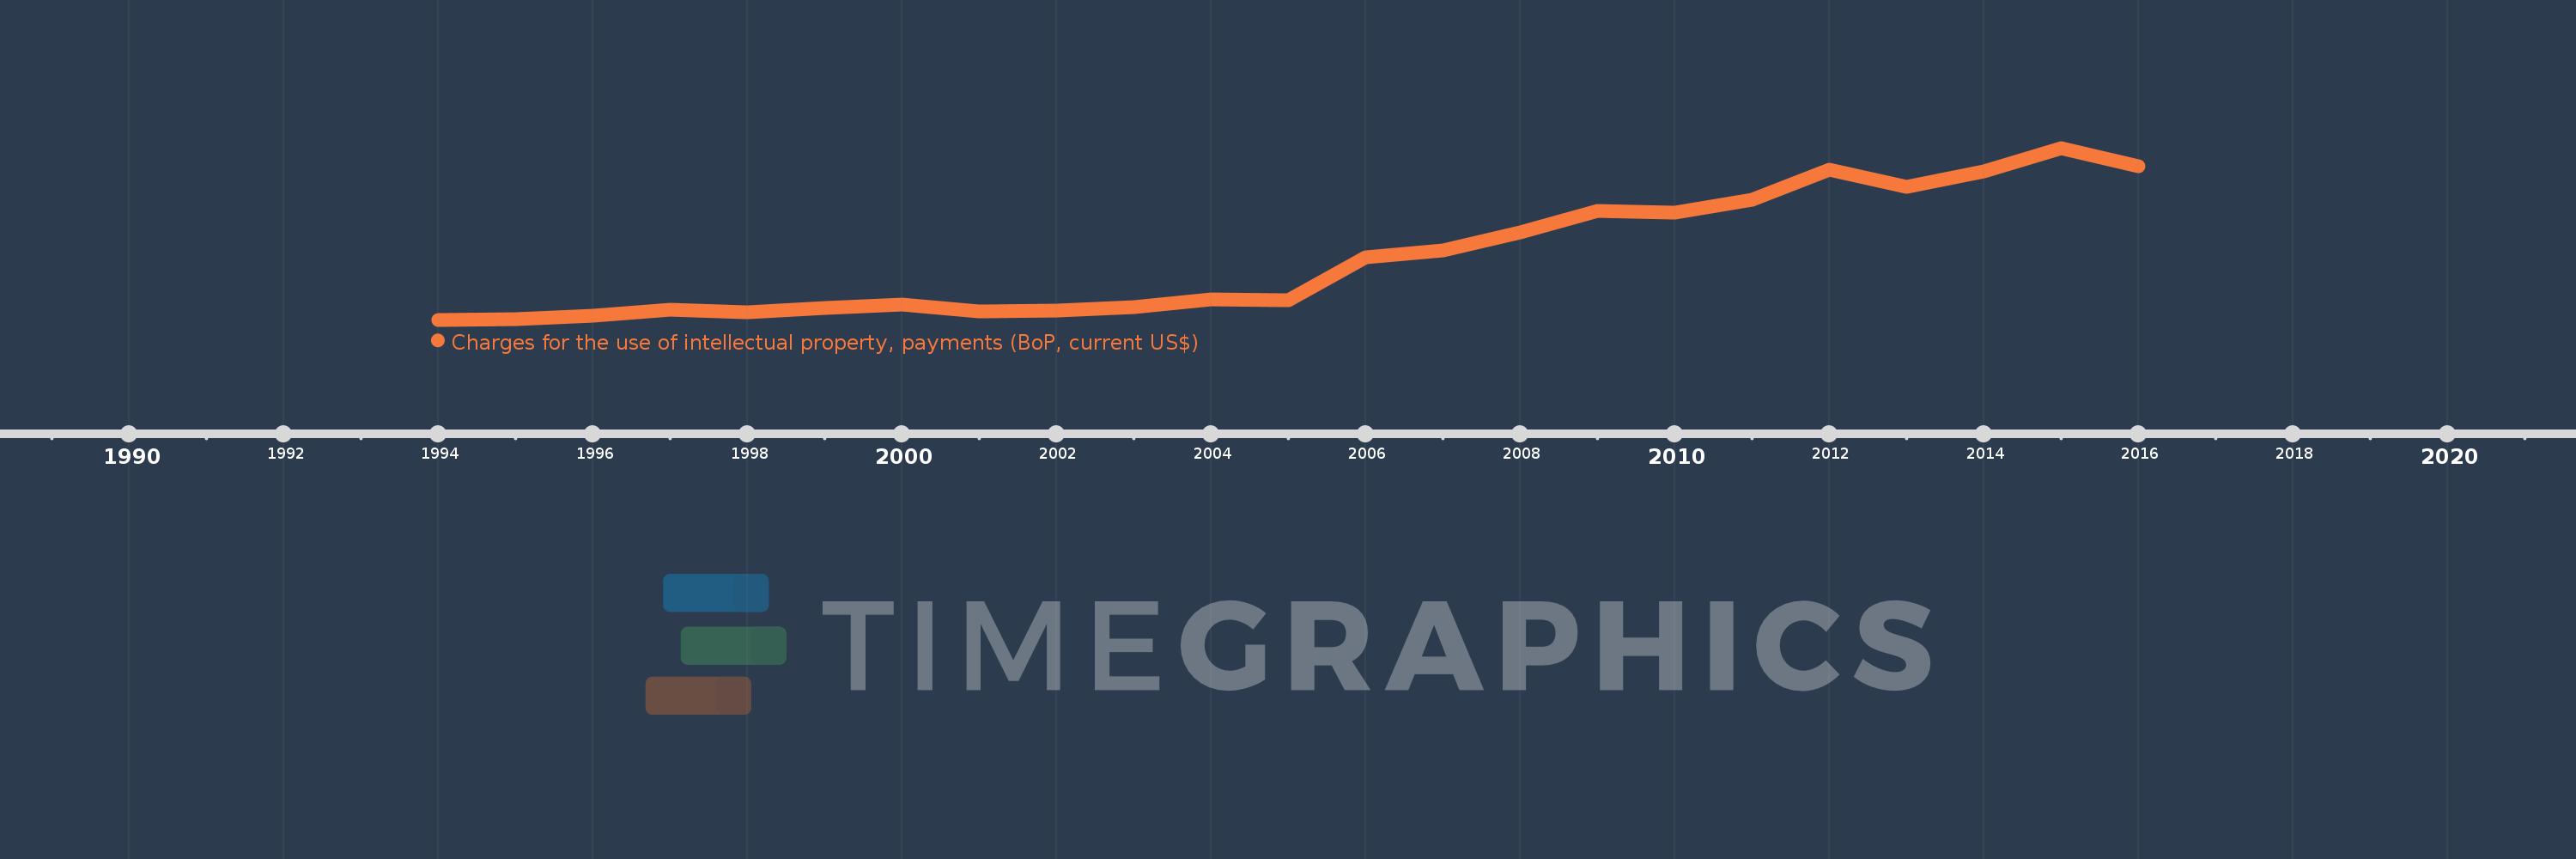
Charges for the use of intellectual property, payments (BoP, current US$)
2016,2015,2014,2013,2012,2011,2010,2009,2008,2007,2006,2005,2004,2003,2002,2001,2000,1999,1998,1997,1996,1995,1994
This statistics in other country:
Timeline:
This timeline shows a graph from 1994 to 2016 of Czech Republic. No data until 1993. Number of actual observations by date: 23.
Source name:
World Development Indicators
Source organization:
International Monetary Fund, Balance of Payments Statistics Yearbook and data files.
Categories, topics:
Economy & Growth, Science & Technology
Last updated:
apr 23, 2017
Indicators value changes by year
Minimum:
20.382 mln
jan 1, 1994
Maximum:
1.344 bln
jan 1, 2015
At the date of observation
Value
Absolute change
Change from previous value
jan 1, 1994
20.382 mln
+20.382 mln
0.0%
jan 1, 1995
26.273 mln
+5.891 mln
28.9%
jan 1, 1996
53.328 mln
+27.055 mln
102.98%
jan 1, 1997
97.955 mln
+44.627 mln
83.68%
jan 1, 1998
77.862 mln
-20.093 mln
-20.51%
jan 1, 1999
112.645 mln
+34.783 mln
44.67%
jan 1, 2000
137.44 mln
+24.795 mln
22.01%
jan 1, 2001
81.726 mln
-55.714 mln
-40.54%
jan 1, 2002
92.706 mln
+10.98 mln
13.44%
jan 1, 2003
119.236 mln
+26.53 mln
28.62%
jan 1, 2004
175.866 mln
+56.63 mln
47.49%
jan 1, 2005
173.657 mln
-2.209 mln
-1.26%
jan 1, 2006
503.648 mln
+329.991 mln
190.02%
jan 1, 2007
551.394 mln
+47.746 mln
9.48%
jan 1, 2008
694.052 mln
+142.658 mln
25.87%
jan 1, 2009
859.173 mln
+165.122 mln
23.79%
jan 1, 2010
842.489 mln
-16.684 mln
-1.94%
jan 1, 2011
945.087 mln
+102.597 mln
12.18%
jan 1, 2012
1.179 bln
+234.131 mln
24.77%
jan 1, 2013
1.043 bln
-136.365 mln
-11.56%
jan 1, 2014
1.161 bln
+117.651 mln
11.28%
jan 1, 2015
1.344 bln
+183.327 mln
15.8%
jan 1, 2016
1.203 bln
-140.385 mln
-10.45%
Ranking of countries by current statistics by years


Comments: