29
/
en
AIzaSyAYiBZKx7MnpbEhh9jyipgxe19OcubqV5w
April 1, 2024
124525
Egypt, Arab Rep.
EGY
true
2
1
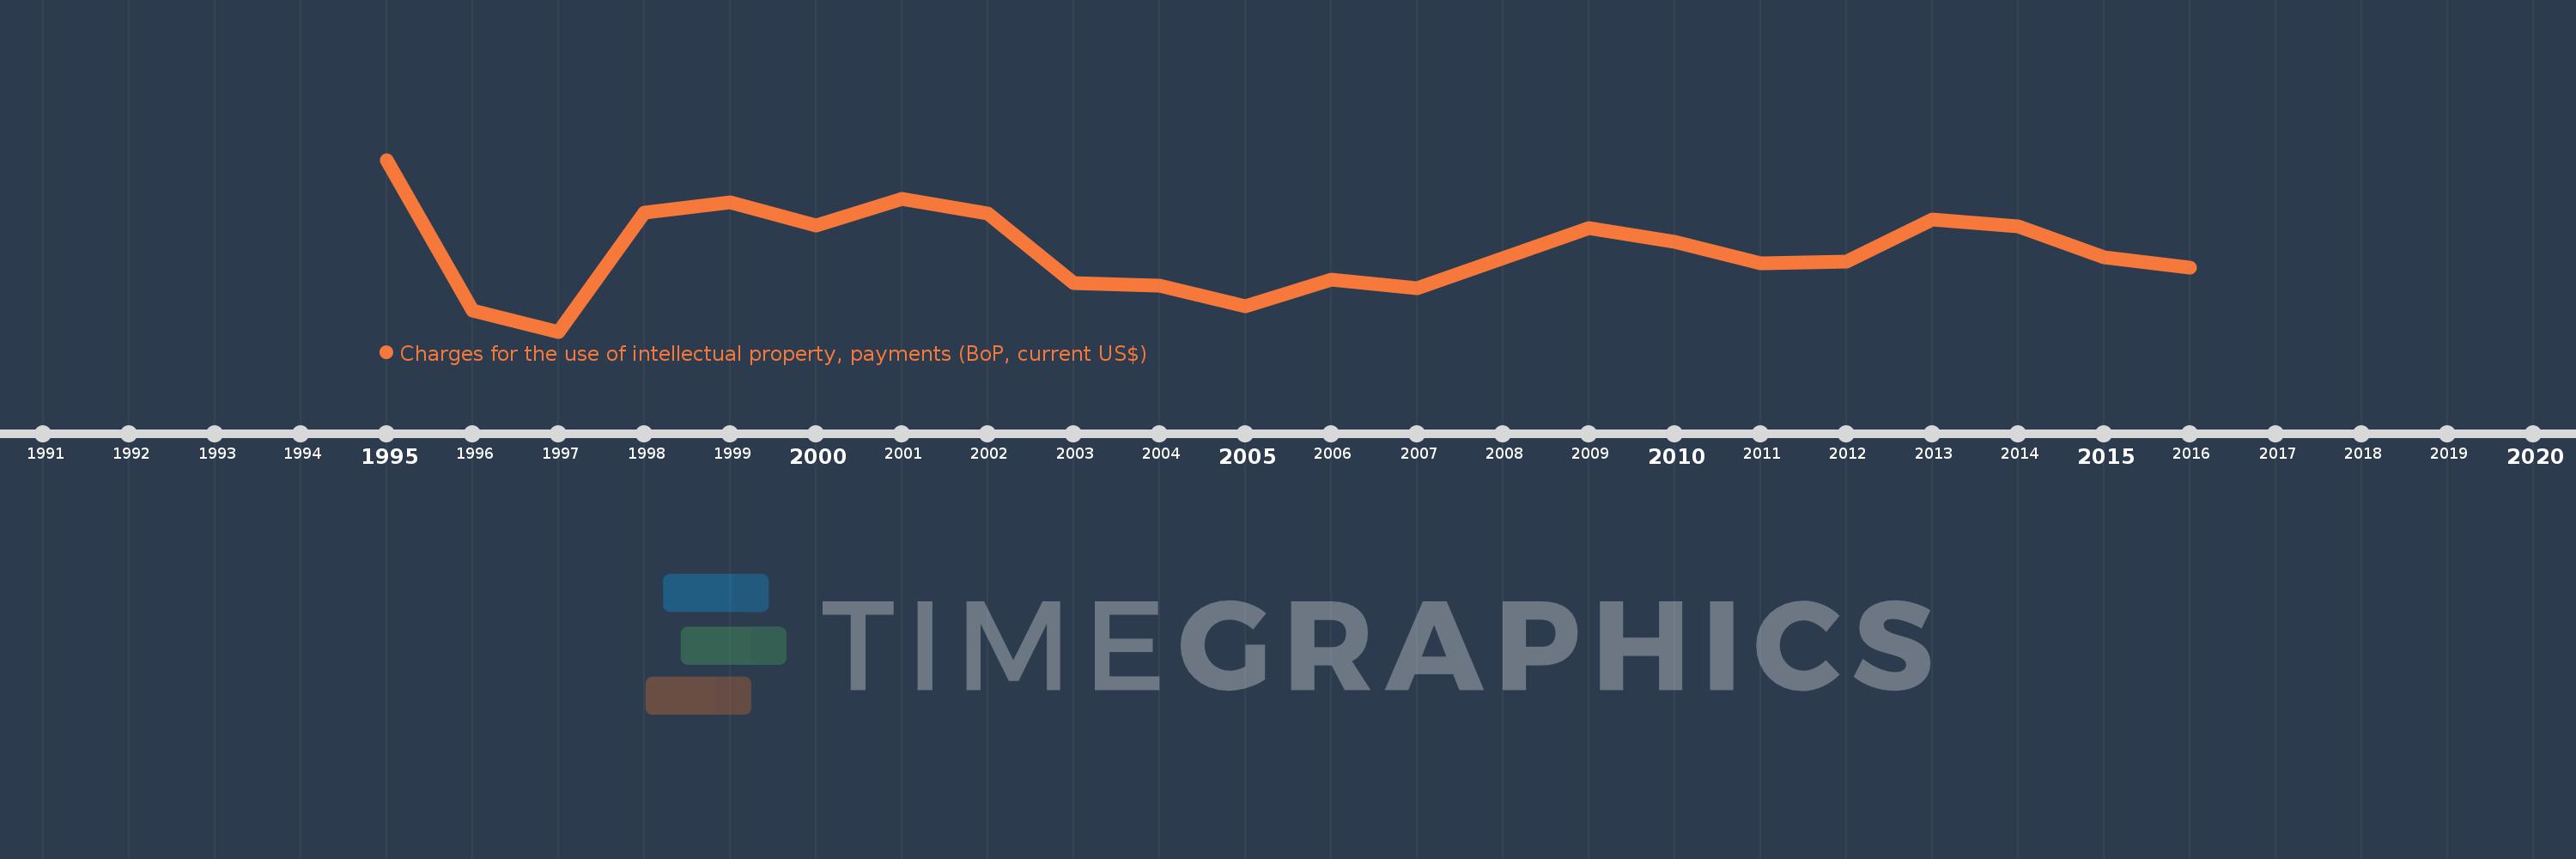
Charges for the use of intellectual property, payments (BoP, current US$)
2016,2015,2014,2013,2012,2011,2010,2009,2008,2007,2006,2005,2004,2003,2002,2001,2000,1999,1998,1997,1996,1995
This statistics in other country:
Timeline:
This timeline shows a graph from 1995 to 2016 of Egypt, Arab Rep.. No data until 1994. Number of actual observations by date: 22.
Source name:
World Development Indicators
Source organization:
International Monetary Fund, Balance of Payments Statistics Yearbook and data files.
Categories, topics:
Economy & Growth, Science & Technology
Last updated:
apr 23, 2017
Indicators value changes by year
Minimum:
40.0 mln
jan 1, 1997
Maximum:
508.0 mln
jan 1, 1995
At the date of observation
Value
Absolute change
Change from previous value
jan 1, 1995
508.0 mln
+508.0 mln
0.0%
jan 1, 1996
97.0 mln
-411.0 mln
-80.91%
jan 1, 1997
40.0 mln
-57.0 mln
-58.76%
jan 1, 1998
364.9 mln
+324.9 mln
812.25%
jan 1, 1999
392.0 mln
+27.1 mln
7.43%
jan 1, 2000
328.9 mln
-63.1 mln
-16.1%
jan 1, 2001
401.0 mln
+72.1 mln
21.92%
jan 1, 2002
360.9 mln
-40.1 mln
-10.0%
jan 1, 2003
171.1 mln
-189.8 mln
-52.59%
jan 1, 2004
165.0 mln
-6.1 mln
-3.57%
jan 1, 2005
108.1 mln
-56.9 mln
-34.48%
jan 1, 2006
182.0 mln
+73.9 mln
68.36%
jan 1, 2007
159.2 mln
-22.8 mln
-12.53%
jan 1, 2008
240.6 mln
+81.4 mln
51.13%
jan 1, 2009
321.6 mln
+81.0 mln
33.67%
jan 1, 2010
284.5 mln
-37.1 mln
-11.54%
jan 1, 2011
226.0 mln
-58.5 mln
-20.56%
jan 1, 2012
231.6 mln
+5.6 mln
2.48%
jan 1, 2013
344.7 mln
+113.1 mln
48.83%
jan 1, 2014
327.5 mln
-17.2 mln
-4.99%
jan 1, 2015
241.5 mln
-86.0 mln
-26.26%
jan 1, 2016
213.8 mln
-27.7 mln
-11.47%
Ranking of countries by current statistics by years


Comments: