29
/
en
AIzaSyAYiBZKx7MnpbEhh9jyipgxe19OcubqV5w
April 1, 2024
24716
Caribbean small states
CSS
false
2
1
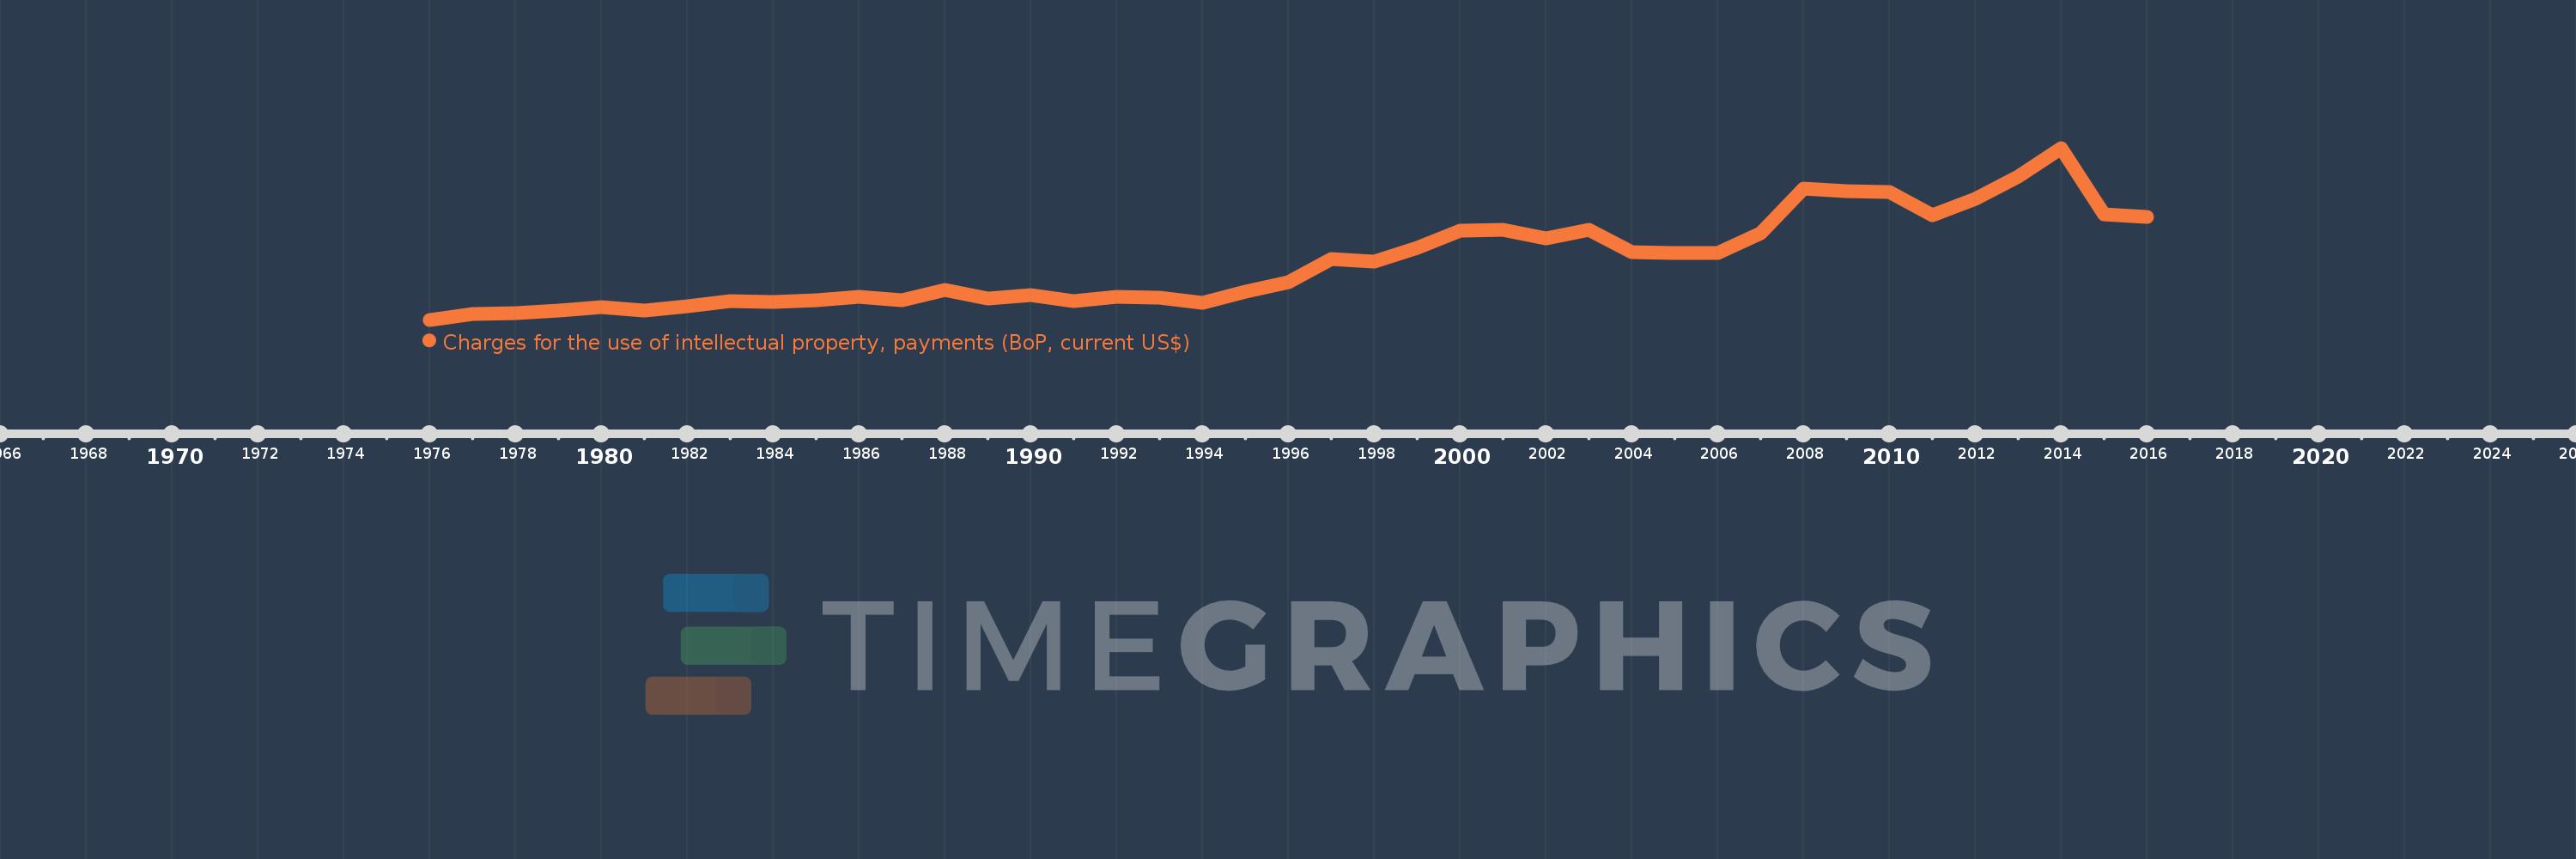
Charges for the use of intellectual property, payments (BoP, current US$)
2016,2015,2014,2013,2012,2011,2010,2009,2008,2007,2006,2005,2004,2003,2002,2001,2000,1999,1998,1997,1996,1995,1994,1993,1992,1991,1990,1989,1988,1987,1986,1985,1984,1983,1982,1981,1980,1979,1978,1977,1976
This statistics in other country:
Timeline:
This timeline shows a graph from 1976 to 2016 of Caribbean small states. No data until 1975. Number of actual observations by date: 41.
Source name:
World Development Indicators
Source organization:
International Monetary Fund, Balance of Payments Statistics Yearbook and data files.
Categories, topics:
Economy & Growth, Science & Technology
Last updated:
apr 23, 2017
Indicators value changes by year
Minimum:
1.705 mln
jan 1, 1976
Maximum:
183.124 mln
jan 1, 2014
At the date of observation
Value
Absolute change
Change from previous value
jan 1, 1976
1.705 mln
+1.705 mln
0.0%
jan 1, 1977
8.112 mln
+6.406 mln
375.69%
jan 1, 1978
8.742 mln
+629.996K
7.77%
jan 1, 1979
10.975 mln
+2.233 mln
25.55%
jan 1, 1980
15.225 mln
+4.25 mln
38.72%
jan 1, 1981
11.592 mln
-3.633 mln
-23.86%
jan 1, 1982
16.208 mln
+4.617 mln
39.83%
jan 1, 1983
21.675 mln
+5.467 mln
33.73%
jan 1, 1984
20.192 mln
-1.483 mln
-6.84%
jan 1, 1985
22.05 mln
+1.858 mln
9.2%
jan 1, 1986
25.567 mln
+3.517 mln
15.95%
jan 1, 1987
22.526 mln
-3.041 mln
-11.9%
jan 1, 1988
33.094 mln
+10.569 mln
46.92%
jan 1, 1989
24.003 mln
-9.091 mln
-27.47%
jan 1, 1990
27.556 mln
+3.552 mln
14.8%
jan 1, 1991
21.695 mln
-5.861 mln
-21.27%
jan 1, 1992
25.548 mln
+3.853 mln
17.76%
jan 1, 1993
24.811 mln
-736.71K
-2.88%
jan 1, 1994
19.531 mln
-5.281 mln
-21.28%
jan 1, 1995
31.576 mln
+12.046 mln
61.68%
jan 1, 1996
41.544 mln
+9.967 mln
31.57%
jan 1, 1997
65.585 mln
+24.041 mln
57.87%
jan 1, 1998
62.887 mln
-2.697 mln
-4.11%
jan 1, 1999
77.773 mln
+14.886 mln
23.67%
jan 1, 2000
95.347 mln
+17.574 mln
22.6%
jan 1, 2001
96.576 mln
+1.229 mln
1.29%
jan 1, 2002
87.461 mln
-9.114 mln
-9.44%
jan 1, 2003
96.757 mln
+9.296 mln
10.63%
jan 1, 2004
73.326 mln
-23.431 mln
-24.22%
jan 1, 2005
72.532 mln
-794.424K
-1.08%
jan 1, 2006
72.34 mln
-192.058K
-0.26%
jan 1, 2007
92.924 mln
+20.584 mln
28.45%
jan 1, 2008
139.839 mln
+46.916 mln
50.49%
jan 1, 2009
137.078 mln
-2.761 mln
-1.97%
jan 1, 2010
136.343 mln
-734.388K
-0.54%
jan 1, 2011
112.454 mln
-23.889 mln
-17.52%
jan 1, 2012
129.168 mln
+16.714 mln
14.86%
jan 1, 2013
153.028 mln
+23.86 mln
18.47%
jan 1, 2014
183.124 mln
+30.097 mln
19.67%
jan 1, 2015
112.927 mln
-70.197 mln
-38.33%
jan 1, 2016
110.509 mln
-2.418 mln
-2.14%
Ranking of countries by current statistics by years


Comments: