29
/
en
AIzaSyAYiBZKx7MnpbEhh9jyipgxe19OcubqV5w
April 1, 2024
53252
Other small states
OSS
false
2
1
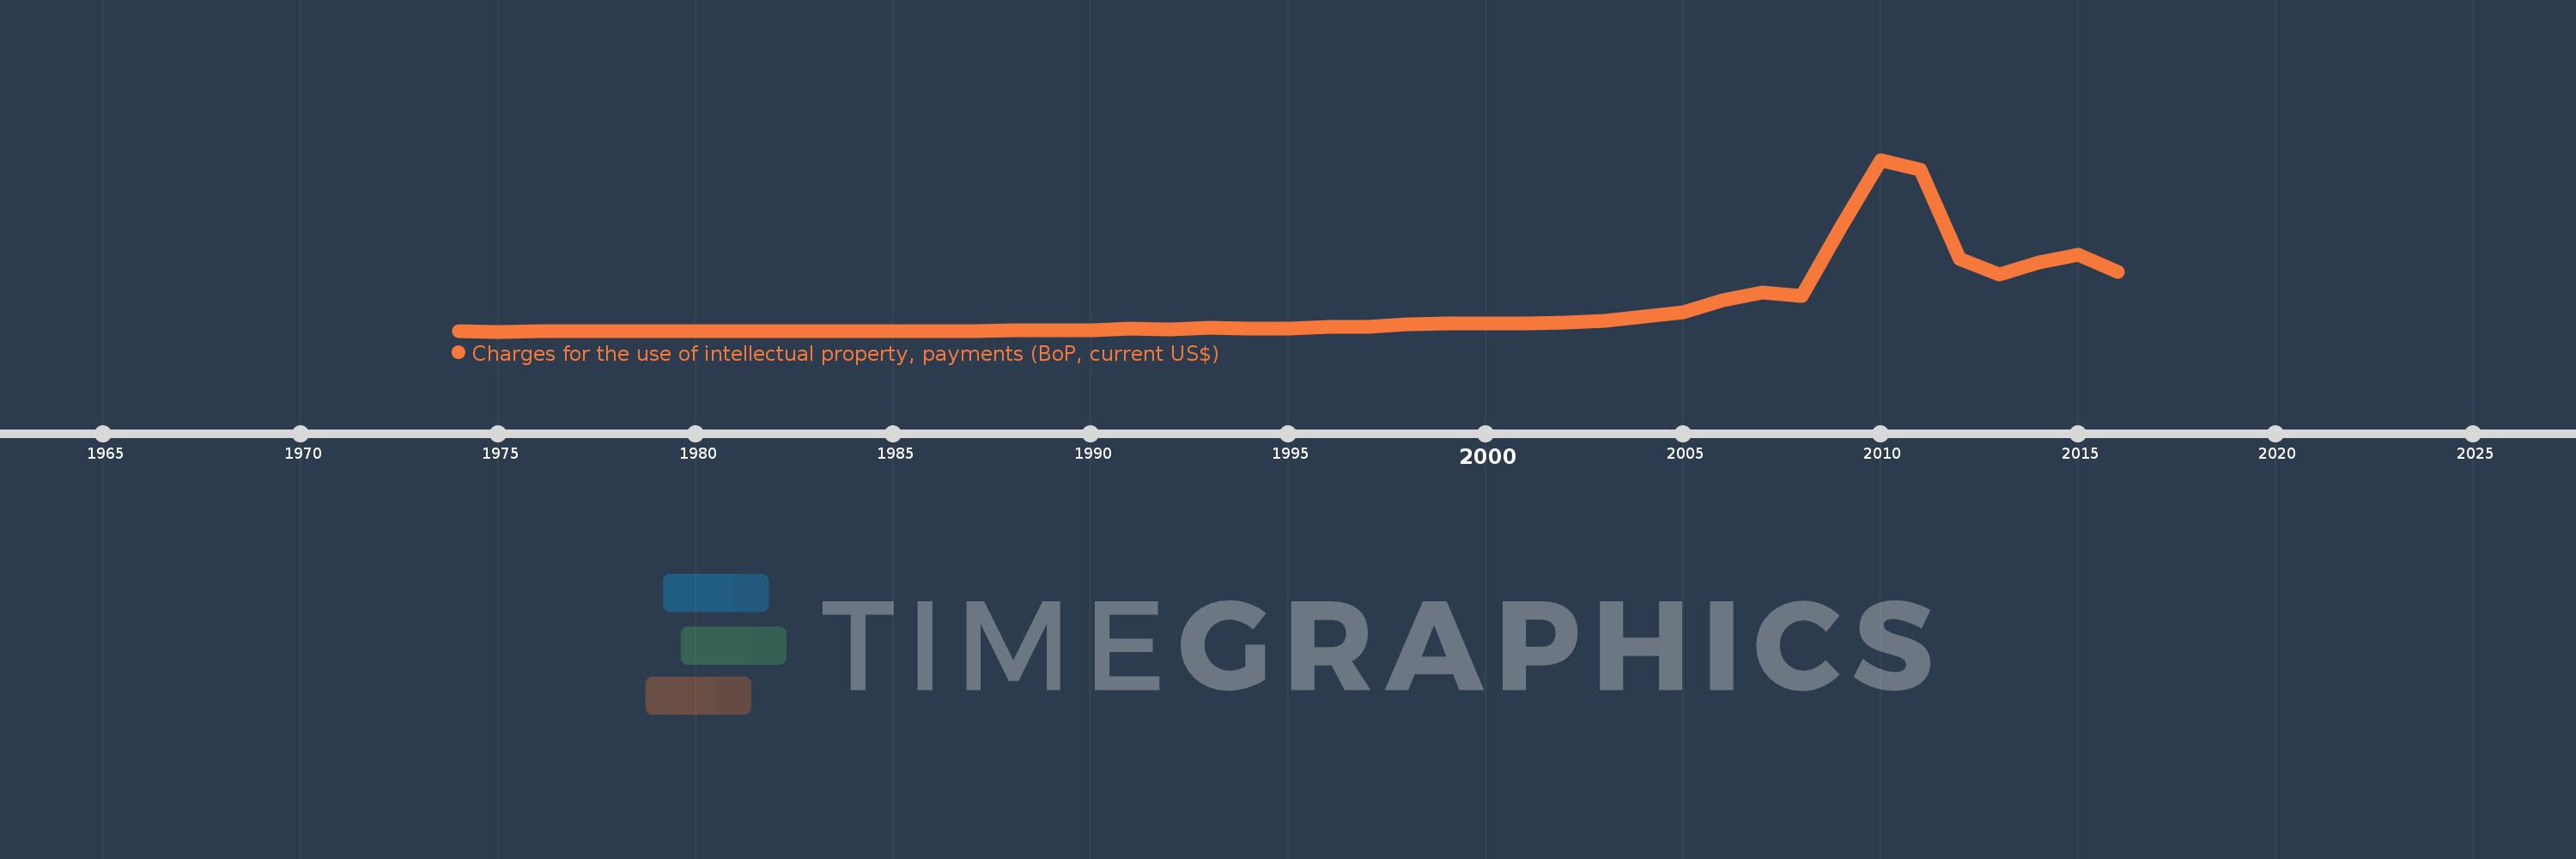
Charges for the use of intellectual property, payments (BoP, current US$)
2016,2015,2014,2013,2012,2011,2010,2009,2008,2007,2006,2005,2004,2003,2002,2001,2000,1999,1998,1997,1996,1995,1994,1993,1992,1991,1990,1989,1988,1987,1986,1985,1984,1983,1982,1981,1980,1979,1978,1977,1976,1975,1974
This statistics in other country:
Timeline:
This timeline shows a graph from 1974 to 2016 of Other small states. No data until 1973. Number of actual observations by date: 43.
Source name:
World Development Indicators
Source organization:
International Monetary Fund, Balance of Payments Statistics Yearbook and data files.
Categories, topics:
Economy & Growth, Science & Technology
Last updated:
apr 23, 2017
Indicators value changes by year
Minimum:
259.416K
jan 1, 1975
Maximum:
1.819 bln
jan 1, 2010
At the date of observation
Value
Absolute change
Change from previous value
jan 1, 1974
271.152K
+271.152K
0.0%
jan 1, 1975
259.416K
-11.736K
-4.33%
jan 1, 1976
519.773K
+260.357K
100.36%
jan 1, 1977
1.495 mln
+975.078K
187.6%
jan 1, 1978
2.467 mln
+972.566K
65.06%
jan 1, 1979
3.577 mln
+1.11 mln
44.98%
jan 1, 1980
4.492 mln
+914.334K
25.56%
jan 1, 1981
4.911 mln
+419.219K
9.33%
jan 1, 1982
5.082 mln
+171.35K
3.49%
jan 1, 1983
4.271 mln
-810.994K
-15.96%
jan 1, 1984
4.649 mln
+377.835K
8.85%
jan 1, 1985
1.936 mln
-2.713 mln
-58.36%
jan 1, 1986
2.521 mln
+584.946K
30.21%
jan 1, 1987
2.804 mln
+283.42K
11.24%
jan 1, 1988
9.962 mln
+7.158 mln
255.24%
jan 1, 1989
12.397 mln
+2.435 mln
24.44%
jan 1, 1990
14.005 mln
+1.608 mln
12.97%
jan 1, 1991
28.064 mln
+14.06 mln
100.39%
jan 1, 1992
25.193 mln
-2.871 mln
-10.23%
jan 1, 1993
37.603 mln
+12.41 mln
49.26%
jan 1, 1994
33.923 mln
-3.68 mln
-9.79%
jan 1, 1995
36.548 mln
+2.625 mln
7.74%
jan 1, 1996
47.966 mln
+11.418 mln
31.24%
jan 1, 1997
49.205 mln
+1.239 mln
2.58%
jan 1, 1998
80.232 mln
+31.027 mln
63.06%
jan 1, 1999
89.074 mln
+8.842 mln
11.02%
jan 1, 2000
90.589 mln
+1.516 mln
1.7%
jan 1, 2001
90.082 mln
-507.416K
-0.56%
jan 1, 2002
98.105 mln
+8.024 mln
8.91%
jan 1, 2003
112.755 mln
+14.65 mln
14.93%
jan 1, 2004
161.005 mln
+48.249 mln
42.79%
jan 1, 2005
200.508 mln
+39.503 mln
24.54%
jan 1, 2006
328.046 mln
+127.538 mln
63.61%
jan 1, 2007
412.258 mln
+84.212 mln
25.67%
jan 1, 2008
380.317 mln
-31.941 mln
-7.75%
jan 1, 2009
1.11 bln
+729.559 mln
191.83%
jan 1, 2010
1.819 bln
+708.839 mln
63.87%
jan 1, 2011
1.719 bln
-100.062 mln
-5.5%
jan 1, 2012
767.575 mln
-951.078 mln
-55.34%
jan 1, 2013
601.609 mln
-165.966 mln
-21.62%
jan 1, 2014
734.512 mln
+132.903 mln
22.09%
jan 1, 2015
809.535 mln
+75.022 mln
10.21%
jan 1, 2016
628.063 mln
-181.471 mln
-22.42%
Ranking of countries by current statistics by years


Comments: