29
/
en
AIzaSyAYiBZKx7MnpbEhh9jyipgxe19OcubqV5w
April 1, 2024
38786
IDA only
IDX
false
2
1
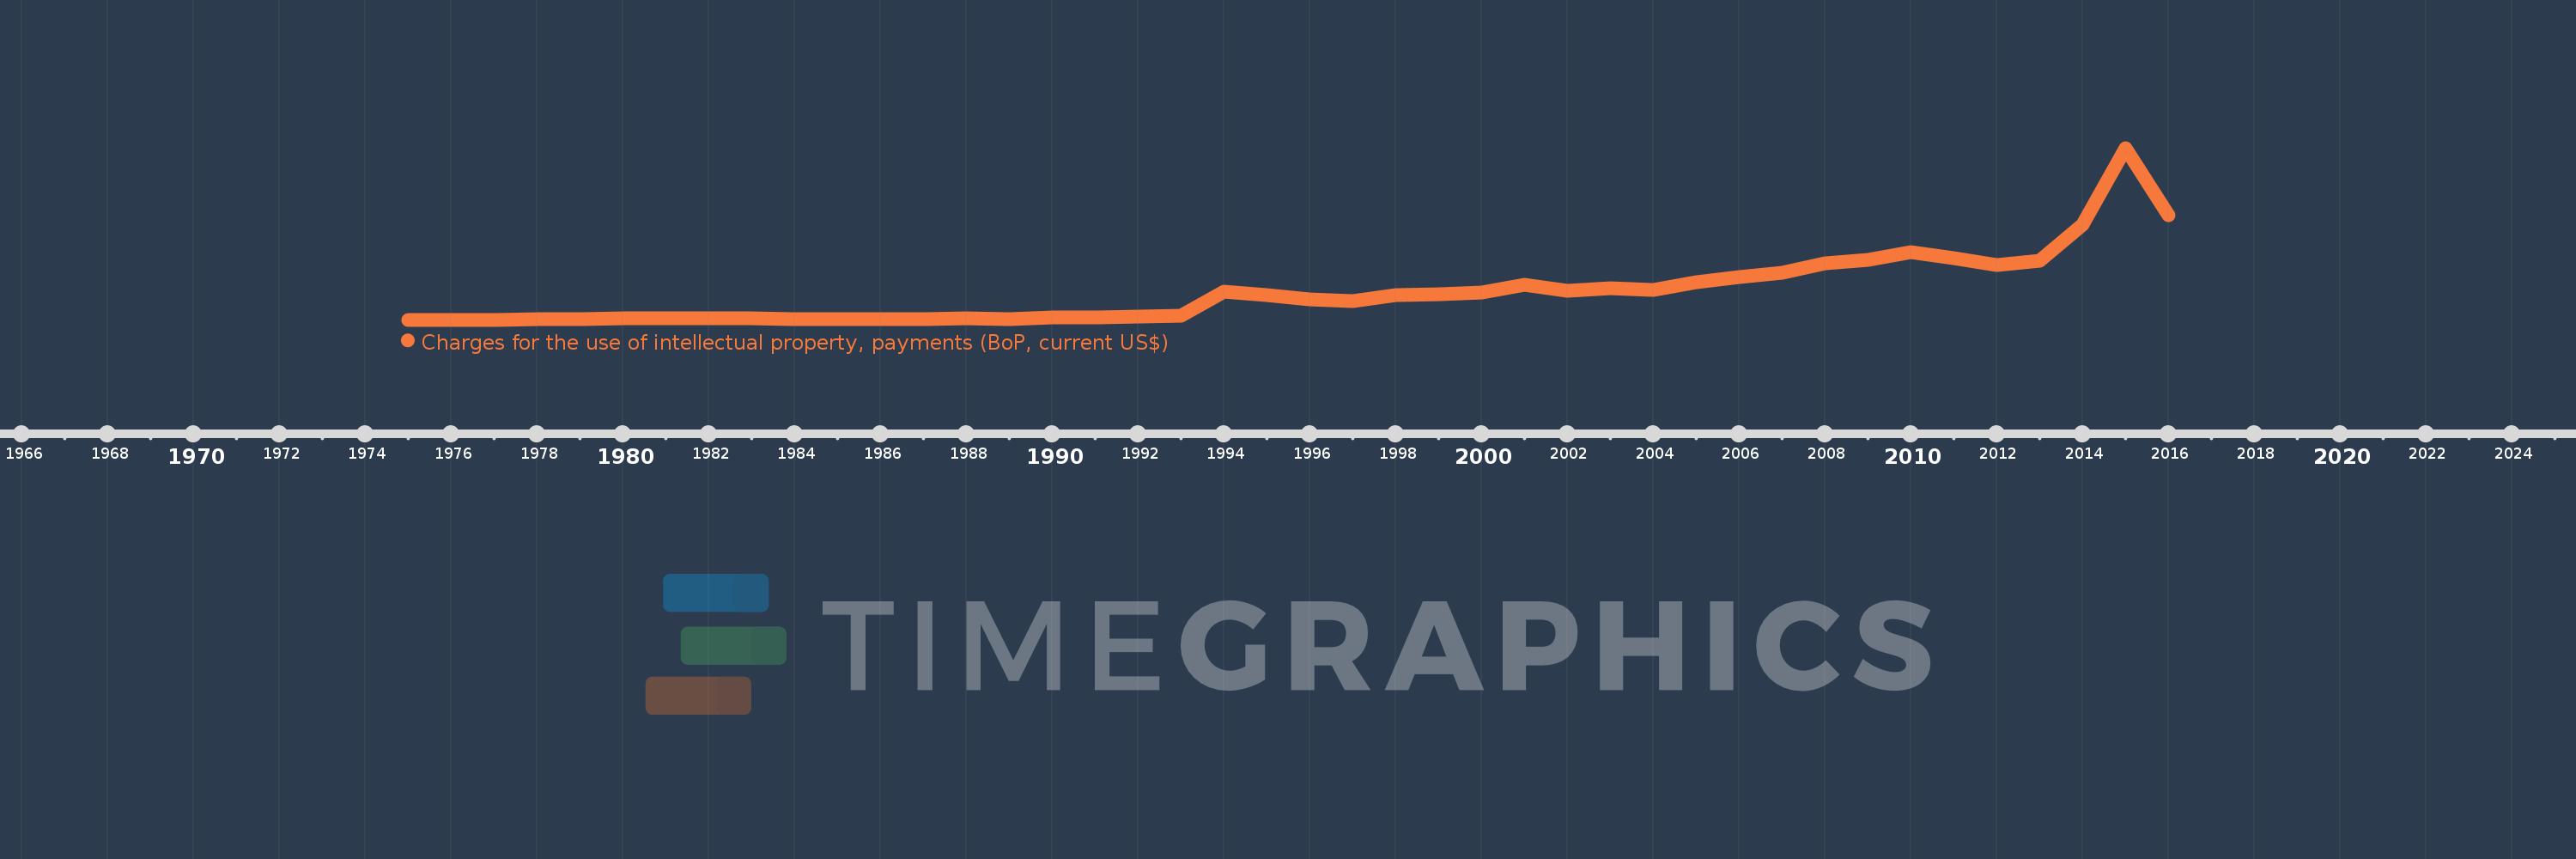
Charges for the use of intellectual property, payments (BoP, current US$)
2016,2015,2014,2013,2012,2011,2010,2009,2008,2007,2006,2005,2004,2003,2002,2001,2000,1999,1998,1997,1996,1995,1994,1993,1992,1991,1990,1989,1988,1987,1986,1985,1984,1983,1982,1981,1980,1979,1978,1977,1976,1975
This statistics in other country:
Timeline:
This timeline shows a graph from 1975 to 2016 of IDA only. No data until 1974. Number of actual observations by date: 42.
Source name:
World Development Indicators
Source organization:
International Monetary Fund, Balance of Payments Statistics Yearbook and data files.
Categories, topics:
Economy & Growth, Science & Technology
Last updated:
apr 23, 2017
Indicators value changes by year
Minimum:
574.634K
jan 1, 1975
Maximum:
709.605 mln
jan 1, 2015
At the date of observation
Value
Absolute change
Change from previous value
jan 1, 1975
574.634K
+574.634K
0.0%
jan 1, 1976
689.982K
+115.348K
20.07%
jan 1, 1977
1.011 mln
+321.351K
46.57%
jan 1, 1978
4.272 mln
+3.261 mln
322.4%
jan 1, 1979
4.646 mln
+374.424K
8.76%
jan 1, 1980
7.54 mln
+2.894 mln
62.29%
jan 1, 1981
6.184 mln
-1.356 mln
-17.99%
jan 1, 1982
6.989 mln
+805.247K
13.02%
jan 1, 1983
7.295 mln
+305.492K
4.37%
jan 1, 1984
3.822 mln
-3.473 mln
-47.6%
jan 1, 1985
2.87 mln
-952.138K
-24.91%
jan 1, 1986
3.349 mln
+478.826K
16.68%
jan 1, 1987
3.281 mln
-67.832K
-2.03%
jan 1, 1988
5.135 mln
+1.854 mln
56.51%
jan 1, 1989
4.5 mln
-634.891K
-12.36%
jan 1, 1990
9.588 mln
+5.088 mln
113.07%
jan 1, 1991
11.108 mln
+1.52 mln
15.85%
jan 1, 1992
13.077 mln
+1.969 mln
17.72%
jan 1, 1993
16.599 mln
+3.522 mln
26.93%
jan 1, 1994
115.914 mln
+99.315 mln
598.32%
jan 1, 1995
103.377 mln
-12.538 mln
-10.82%
jan 1, 1996
85.706 mln
-17.671 mln
-17.09%
jan 1, 1997
79.037 mln
-6.669 mln
-7.78%
jan 1, 1998
102.323 mln
+23.286 mln
29.46%
jan 1, 1999
107.121 mln
+4.798 mln
4.69%
jan 1, 2000
112.806 mln
+5.685 mln
5.31%
jan 1, 2001
145.716 mln
+32.91 mln
29.17%
jan 1, 2002
120.687 mln
-25.029 mln
-17.18%
jan 1, 2003
131.841 mln
+11.153 mln
9.24%
jan 1, 2004
122.631 mln
-9.21 mln
-6.99%
jan 1, 2005
156.866 mln
+34.235 mln
27.92%
jan 1, 2006
175.245 mln
+18.38 mln
11.72%
jan 1, 2007
194.274 mln
+19.028 mln
10.86%
jan 1, 2008
233.467 mln
+39.194 mln
20.17%
jan 1, 2009
249.106 mln
+15.638 mln
6.7%
jan 1, 2010
278.354 mln
+29.248 mln
11.74%
jan 1, 2011
254.251 mln
-24.103 mln
-8.66%
jan 1, 2012
226.456 mln
-27.795 mln
-10.93%
jan 1, 2013
244.127 mln
+17.671 mln
7.8%
jan 1, 2014
393.18 mln
+149.053 mln
61.06%
jan 1, 2015
709.605 mln
+316.425 mln
80.48%
jan 1, 2016
432.294 mln
-277.311 mln
-39.08%
Ranking of countries by current statistics by years


Comments: