29
/
en
AIzaSyAYiBZKx7MnpbEhh9jyipgxe19OcubqV5w
April 1, 2024
160270
Israel
ISR
true
2
1
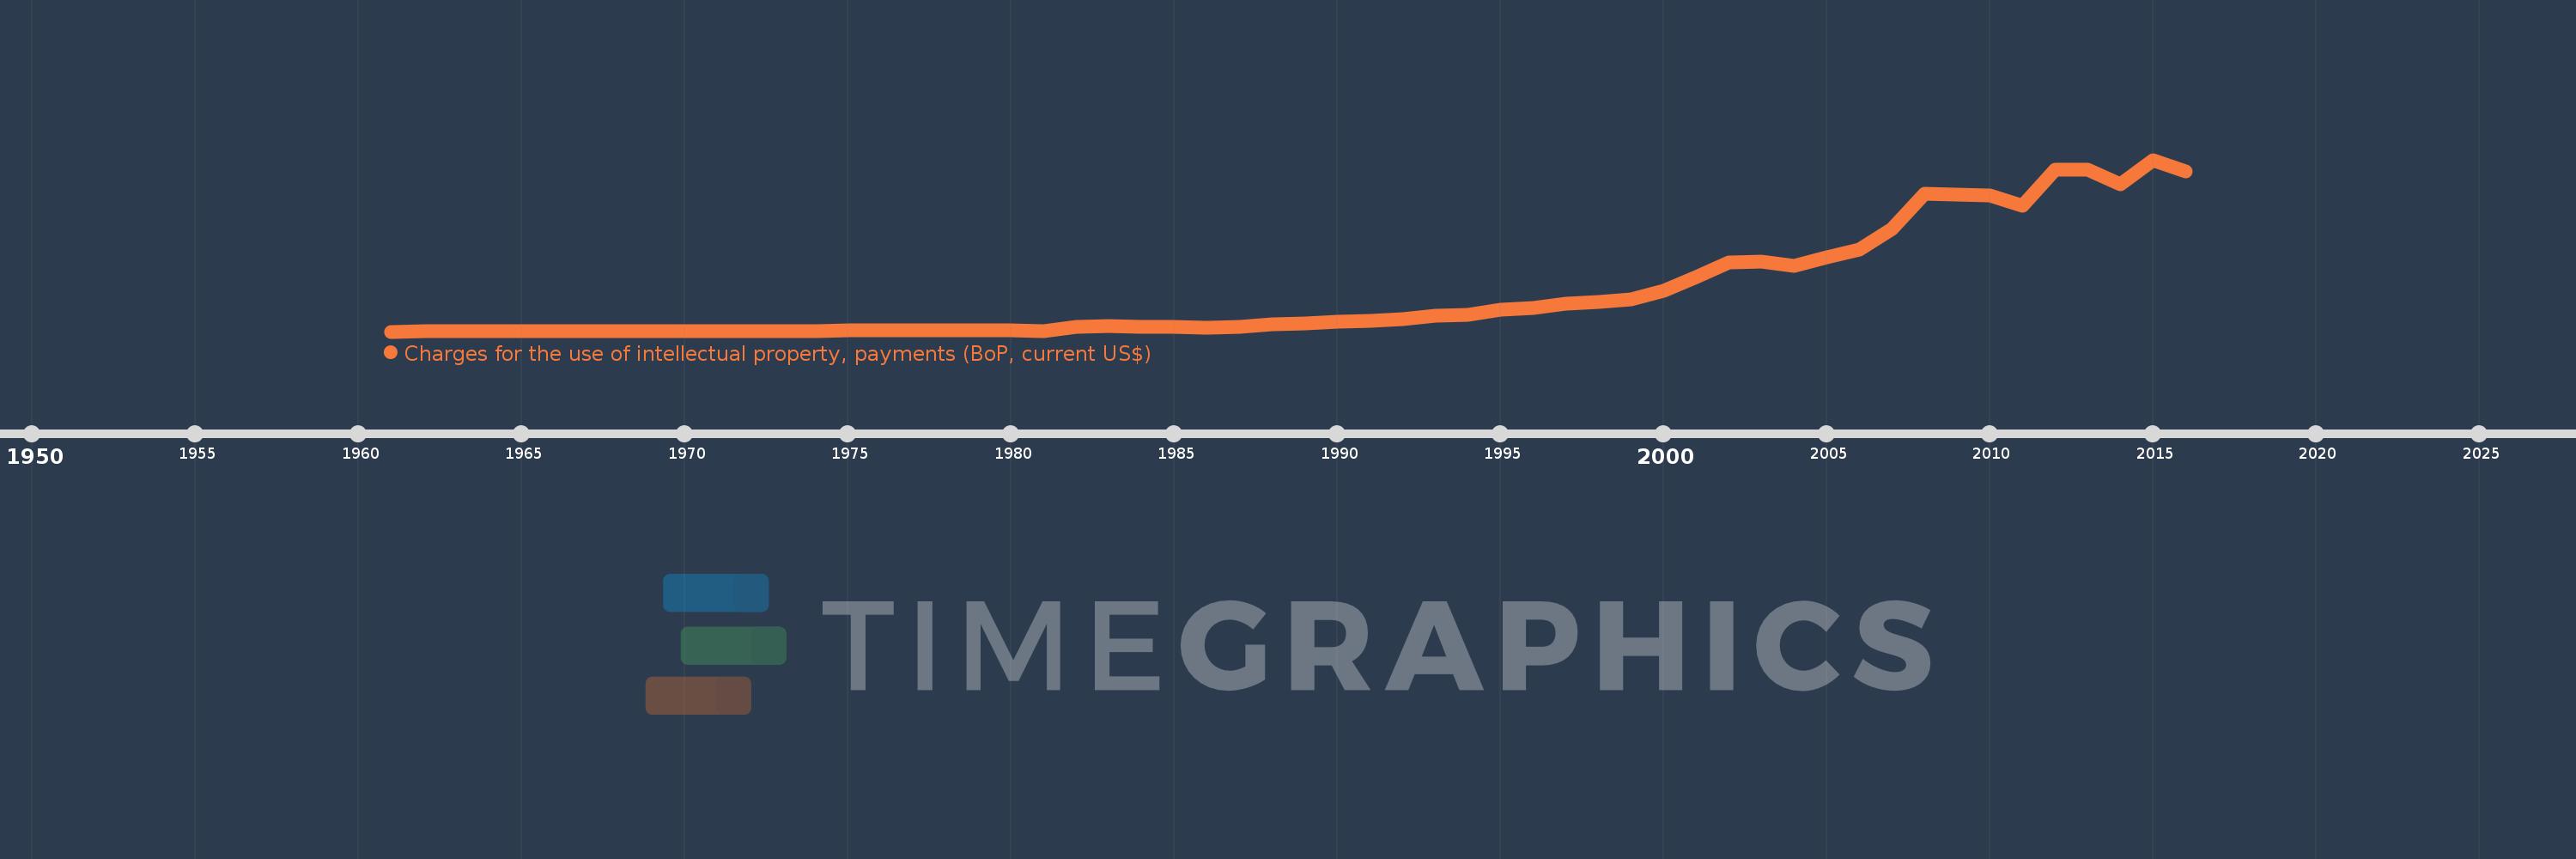
Charges for the use of intellectual property, payments (BoP, current US$)
2016,2015,2014,2013,2012,2011,2010,2009,2008,2007,2006,2005,2004,2003,2002,2001,2000,1999,1998,1997,1996,1995,1994,1993,1992,1991,1990,1989,1988,1987,1986,1985,1984,1983,1982,1981,1980,1979,1978,1977,1976,1975,1974,1973,1972,1971,1970,1969,1968,1967,1966,1962,1961
This statistics in other country:
Timeline:
This timeline shows a graph from 1961 to 2016 of Israel. No data until 1960. Number of actual observations by date: 53.
Source name:
World Development Indicators
Source organization:
International Monetary Fund, Balance of Payments Statistics Yearbook and data files.
Categories, topics:
Economy & Growth, Science & Technology
Last updated:
apr 23, 2017
Indicators value changes by year
Minimum:
1000.0K
jan 1, 1961
Maximum:
1.136 bln
jan 1, 2015
At the date of observation
Value
Absolute change
Change from previous value
jan 1, 1961
1000.0K
+1000.0K
0.0%
jan 1, 1962
2.0 mln
+1000.0K
100.0%
jan 1, 1966
2.0 mln
0.0
0.0%
jan 1, 1967
2.0 mln
0.0
0.0%
jan 1, 1968
2.0 mln
0.0
0.0%
jan 1, 1969
3.0 mln
+1000.0K
50.0%
jan 1, 1970
3.0 mln
0.0
0.0%
jan 1, 1971
3.0 mln
0.0
0.0%
jan 1, 1972
4.0 mln
+1000.0K
33.33%
jan 1, 1973
6.0 mln
+2.0 mln
50.0%
jan 1, 1974
4.0 mln
-2.0 mln
-33.33%
jan 1, 1975
8.0 mln
+4.0 mln
100.0%
jan 1, 1976
9.0 mln
+1000.0K
12.5%
jan 1, 1977
9.0 mln
0.0
0.0%
jan 1, 1978
11.0 mln
+2.0 mln
22.22%
jan 1, 1979
8.0 mln
-3.0 mln
-27.27%
jan 1, 1980
7.0 mln
-1000.0K
-12.5%
jan 1, 1981
3.0 mln
-4.0 mln
-57.14%
jan 1, 1982
31.0 mln
+28.0 mln
933.33%
jan 1, 1983
39.3 mln
+8.3 mln
26.77%
jan 1, 1984
33.9 mln
-5.4 mln
-13.74%
jan 1, 1985
33.3 mln
-600.0K
-1.77%
jan 1, 1986
24.9 mln
-8.4 mln
-25.23%
jan 1, 1987
31.0 mln
+6.1 mln
24.5%
jan 1, 1988
46.7 mln
+15.7 mln
50.65%
jan 1, 1989
55.5 mln
+8.8 mln
18.84%
jan 1, 1990
64.3 mln
+8.8 mln
15.86%
jan 1, 1991
73.1 mln
+8.8 mln
13.69%
jan 1, 1992
85.9 mln
+12.8 mln
17.51%
jan 1, 1993
103.3 mln
+17.4 mln
20.26%
jan 1, 1994
111.3 mln
+8.0 mln
7.74%
jan 1, 1995
148.3 mln
+37.0 mln
33.24%
jan 1, 1996
155.5 mln
+7.2 mln
4.86%
jan 1, 1997
183.3 mln
+27.8 mln
17.88%
jan 1, 1998
195.3 mln
+12.0 mln
6.55%
jan 1, 1999
212.7 mln
+17.4 mln
8.91%
jan 1, 2000
269.6 mln
+56.9 mln
26.75%
jan 1, 2001
360.6 mln
+91.0 mln
33.75%
jan 1, 2002
459.6 mln
+99.0 mln
27.45%
jan 1, 2003
461.8 mln
+2.2 mln
0.48%
jan 1, 2004
433.4 mln
-28.4 mln
-6.15%
jan 1, 2005
490.7 mln
+57.3 mln
13.22%
jan 1, 2006
541.9 mln
+51.2 mln
10.43%
jan 1, 2007
680.9 mln
+139.0 mln
25.65%
jan 1, 2008
912.8 mln
+231.9 mln
34.06%
jan 1, 2009
908.3 mln
-4.5 mln
-0.49%
jan 1, 2010
898.6 mln
-9.7 mln
-1.07%
jan 1, 2011
831.5 mln
-67.1 mln
-7.47%
jan 1, 2012
1.068 bln
+236.8 mln
28.48%
jan 1, 2013
1.073 bln
+4.2 mln
0.39%
jan 1, 2014
973.5 mln
-99.0 mln
-9.23%
jan 1, 2015
1.136 bln
+162.2 mln
16.66%
jan 1, 2016
1.062 bln
-74.1 mln
-6.52%
Ranking of countries by current statistics by years


Comments: