29
/
en
AIzaSyAYiBZKx7MnpbEhh9jyipgxe19OcubqV5w
April 1, 2024
257095
Switzerland
CHE
true
2
1
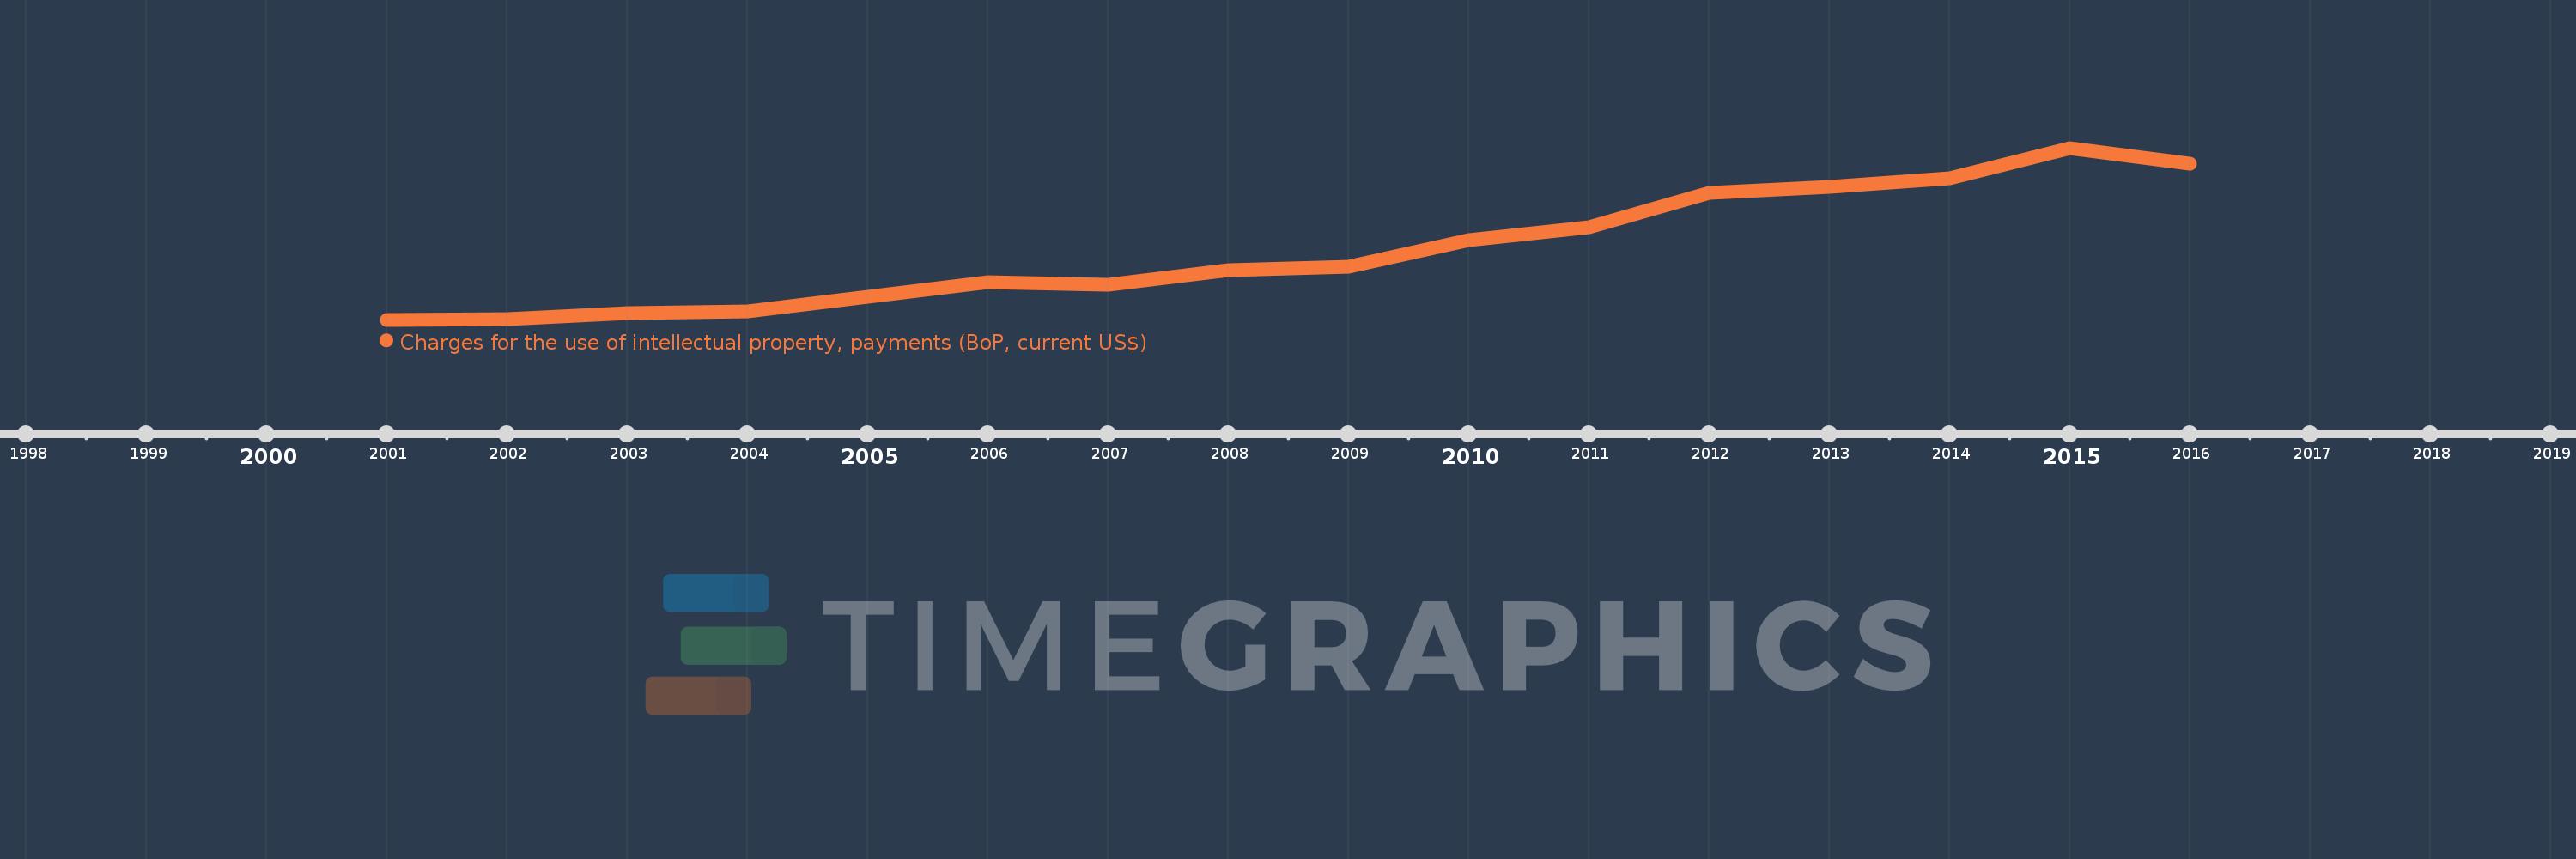
Charges for the use of intellectual property, payments (BoP, current US$)
2016,2015,2014,2013,2012,2011,2010,2009,2008,2007,2006,2005,2004,2003,2002,2001
This statistics in other country:
Timeline:
This timeline shows a graph from 2001 to 2016 of Switzerland. No data until 2000. Number of actual observations by date: 16.
Source name:
World Development Indicators
Source organization:
International Monetary Fund, Balance of Payments Statistics Yearbook and data files.
Categories, topics:
Economy & Growth, Science & Technology
Last updated:
apr 23, 2017
Indicators value changes by year
Minimum:
880.291 mln
jan 1, 2001
Maximum:
14.143 bln
jan 1, 2015
At the date of observation
Value
Absolute change
Change from previous value
jan 1, 2001
880.291 mln
+880.291 mln
0.0%
jan 1, 2002
939.289 mln
+58.998 mln
6.7%
jan 1, 2003
1.368 bln
+428.211 mln
45.59%
jan 1, 2004
1.516 bln
+148.767 mln
10.88%
jan 1, 2005
2.636 bln
+1.12 bln
73.83%
jan 1, 2006
3.769 bln
+1.133 bln
42.98%
jan 1, 2007
3.553 bln
-215.351 mln
-5.71%
jan 1, 2008
4.682 bln
+1.129 bln
31.78%
jan 1, 2009
4.978 bln
+295.68 mln
6.31%
jan 1, 2010
6.996 bln
+2.018 bln
40.53%
jan 1, 2011
8.025 bln
+1.029 bln
14.71%
jan 1, 2012
10.65 bln
+2.625 bln
32.71%
jan 1, 2013
11.111 bln
+461.155 mln
4.33%
jan 1, 2014
11.769 bln
+657.661 mln
5.92%
jan 1, 2015
14.143 bln
+2.374 bln
20.17%
jan 1, 2016
12.932 bln
-1.211 bln
-8.56%
Ranking of countries by current statistics by years


Comments: