29
/
en
AIzaSyAYiBZKx7MnpbEhh9jyipgxe19OcubqV5w
April 1, 2024
254943
Swaziland
SWZ
true
2
1
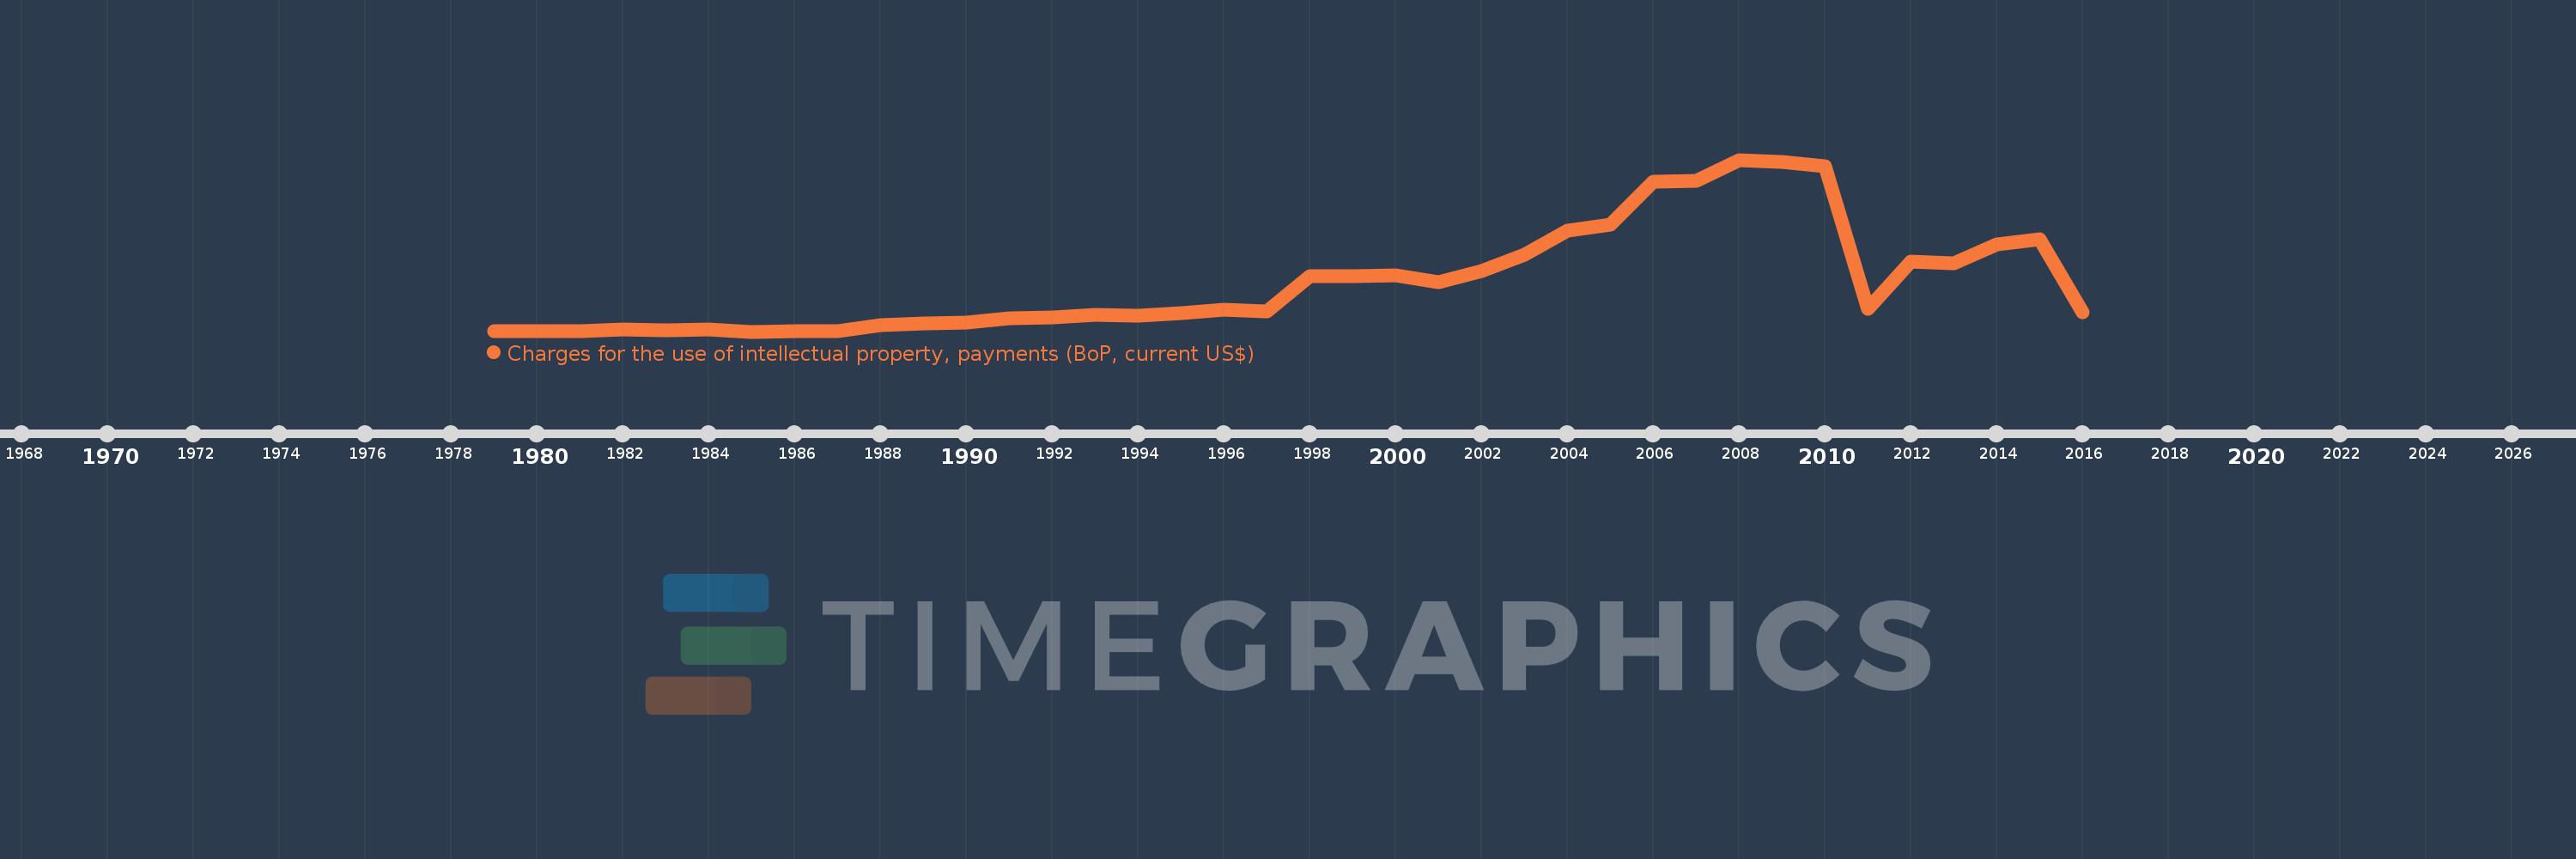
Charges for the use of intellectual property, payments (BoP, current US$)
2016,2015,2014,2013,2012,2011,2010,2009,2008,2007,2006,2005,2004,2003,2002,2001,2000,1999,1998,1997,1996,1995,1994,1993,1992,1991,1990,1989,1988,1987,1986,1985,1984,1983,1982,1981,1980,1979
This statistics in other country:
Timeline:
This timeline shows a graph from 1979 to 2016 of Swaziland. No data until 1978. Number of actual observations by date: 38.
Source name:
World Development Indicators
Source organization:
International Monetary Fund, Balance of Payments Statistics Yearbook and data files.
Categories, topics:
Economy & Growth, Science & Technology
Last updated:
apr 23, 2017
Indicators value changes by year
Minimum:
203.352K
jan 1, 1985
Maximum:
120.988 mln
jan 1, 2008
At the date of observation
Value
Absolute change
Change from previous value
jan 1, 1979
230.0K
+230.0K
0.0%
jan 1, 1980
712.76K
+482.76K
209.9%
jan 1, 1981
770.426K
+57.666K
8.09%
jan 1, 1982
1.711 mln
+941.037K
122.14%
jan 1, 1983
1.381 mln
-330.013K
-19.28%
jan 1, 1984
1.885 mln
+503.48K
36.45%
jan 1, 1985
203.352K
-1.682 mln
-89.21%
jan 1, 1986
584.817K
+381.466K
187.59%
jan 1, 1987
568.92K
-15.898K
-2.72%
jan 1, 1988
4.764 mln
+4.195 mln
737.41%
jan 1, 1989
6.07 mln
+1.306 mln
27.41%
jan 1, 1990
6.749 mln
+678.805K
11.18%
jan 1, 1991
9.315 mln
+2.566 mln
38.02%
jan 1, 1992
9.995 mln
+680.583K
7.31%
jan 1, 1993
11.921 mln
+1.926 mln
19.27%
jan 1, 1994
11.475 mln
-446.808K
-3.75%
jan 1, 1995
13.429 mln
+1.954 mln
17.03%
jan 1, 1996
15.574 mln
+2.146 mln
15.98%
jan 1, 1997
14.591 mln
-983.445K
-6.31%
jan 1, 1998
39.27 mln
+24.679 mln
169.14%
jan 1, 1999
39.254 mln
-15.327K
-0.04%
jan 1, 2000
39.902 mln
+647.746K
1.65%
jan 1, 2001
35.065 mln
-4.837 mln
-12.12%
jan 1, 2002
42.8 mln
+7.736 mln
22.06%
jan 1, 2003
54.075 mln
+11.275 mln
26.34%
jan 1, 2004
71.181 mln
+17.106 mln
31.63%
jan 1, 2005
75.601 mln
+4.42 mln
6.21%
jan 1, 2006
105.433 mln
+29.832 mln
39.46%
jan 1, 2007
106.406 mln
+972.489K
0.92%
jan 1, 2008
120.988 mln
+14.582 mln
13.7%
jan 1, 2009
119.691 mln
-1.297 mln
-1.07%
jan 1, 2010
116.34 mln
-3.35 mln
-2.8%
jan 1, 2011
16.309 mln
-100.032 mln
-85.98%
jan 1, 2012
49.701 mln
+33.392 mln
204.75%
jan 1, 2013
48.066 mln
-1.635 mln
-3.29%
jan 1, 2014
61.777 mln
+13.711 mln
28.52%
jan 1, 2015
65.401 mln
+3.624 mln
5.87%
jan 1, 2016
13.862 mln
-51.539 mln
-78.8%
Ranking of countries by current statistics by years


Comments: