29
/
en
AIzaSyAYiBZKx7MnpbEhh9jyipgxe19OcubqV5w
April 1, 2024
72758
Australia
AUS
true
2
1
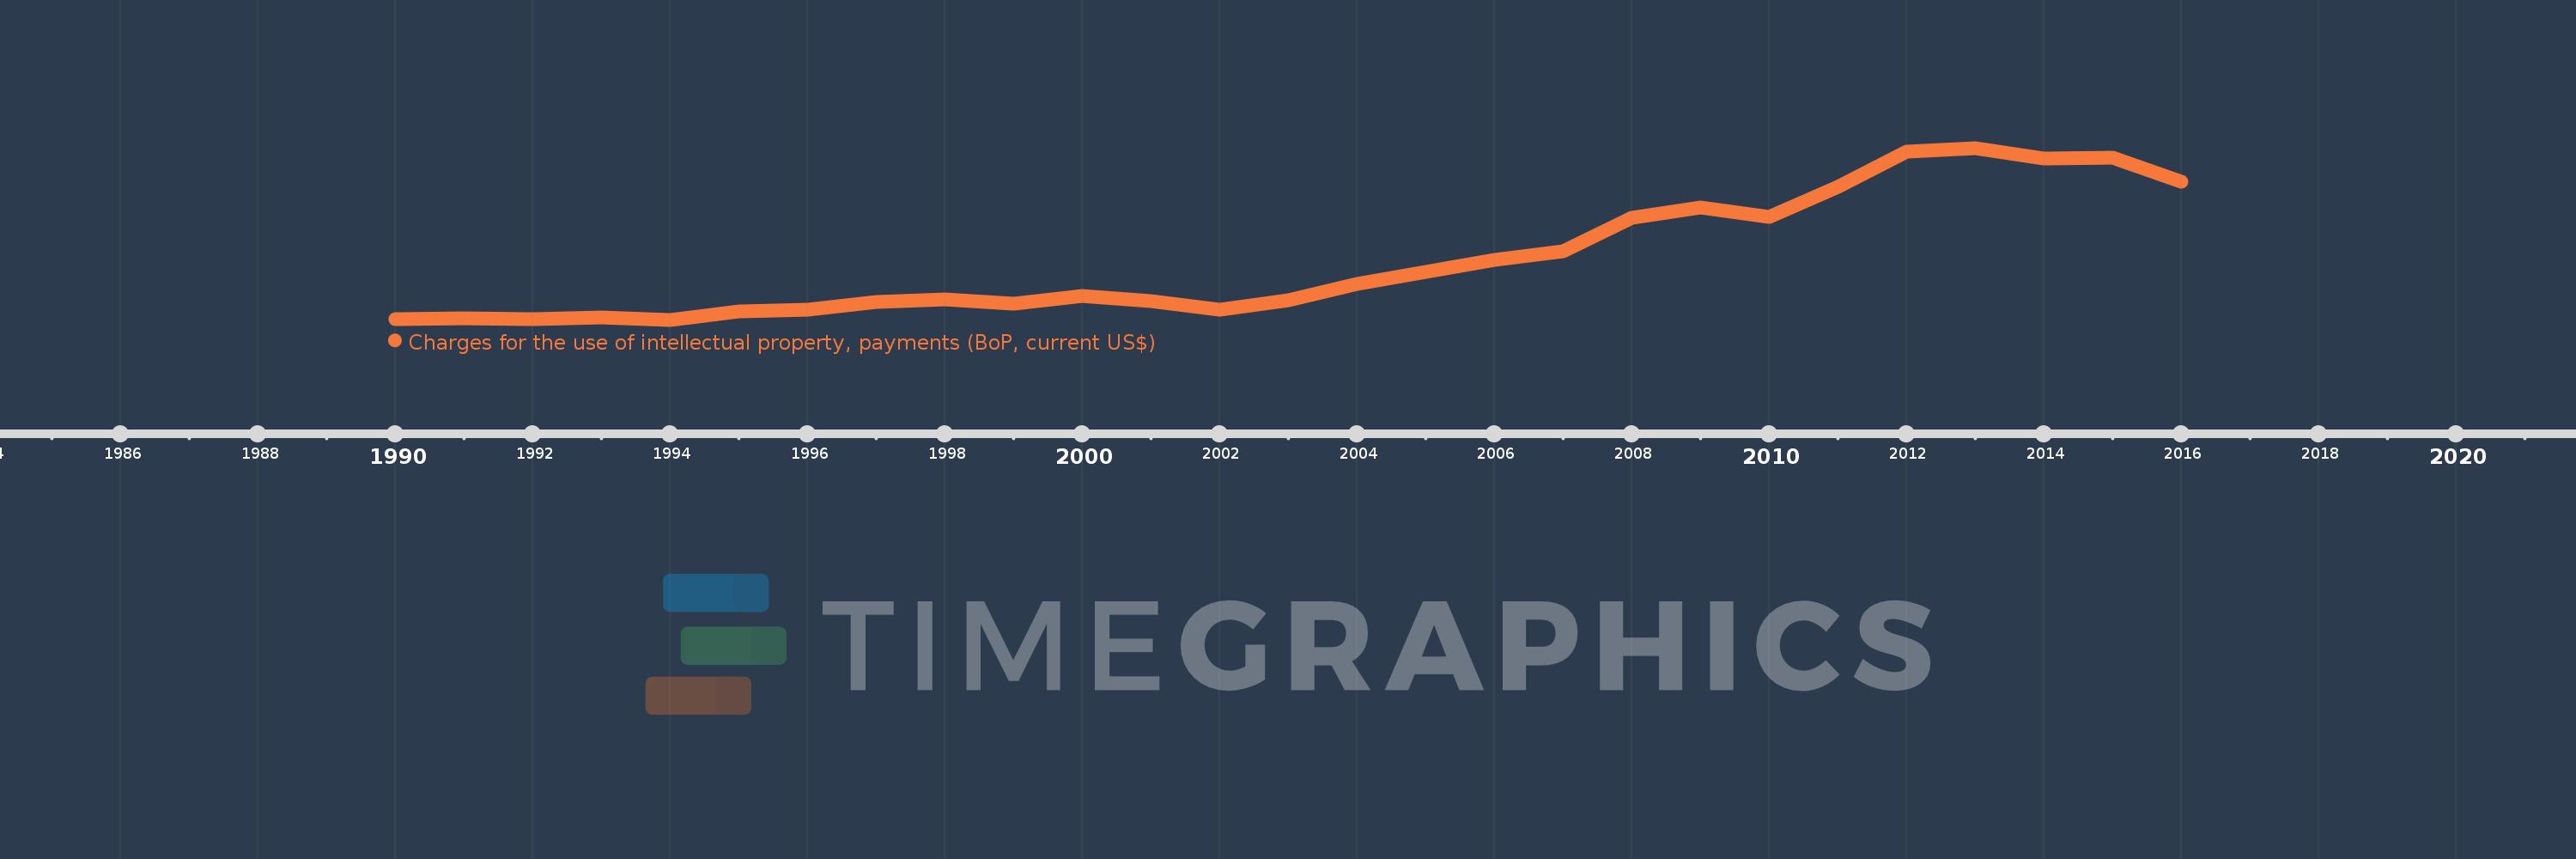
Charges for the use of intellectual property, payments (BoP, current US$)
2016,2015,2014,2013,2012,2011,2010,2009,2008,2007,2006,2005,2004,2003,2002,2001,2000,1999,1998,1997,1996,1995,1994,1993,1992,1991,1990
This statistics in other country:
Timeline:
This timeline shows a graph from 1990 to 2016 of Australia. No data until 1989. Number of actual observations by date: 27.
Source name:
World Development Indicators
Source organization:
International Monetary Fund, Balance of Payments Statistics Yearbook and data files.
Categories, topics:
Economy & Growth, Science & Technology
Last updated:
apr 23, 2017
Indicators value changes by year
Minimum:
798.614 mln
jan 1, 1994
Maximum:
4.186 bln
jan 1, 2013
At the date of observation
Value
Absolute change
Change from previous value
jan 1, 1990
808.156 mln
+808.156 mln
0.0%
jan 1, 1991
825.954 mln
+17.798 mln
2.2%
jan 1, 1992
806.996 mln
-18.958 mln
-2.3%
jan 1, 1993
843.695 mln
+36.7 mln
4.55%
jan 1, 1994
798.614 mln
-45.082 mln
-5.34%
jan 1, 1995
969.759 mln
+171.146 mln
21.43%
jan 1, 1996
1.001 bln
+31.402 mln
3.24%
jan 1, 1997
1.147 bln
+145.723 mln
14.56%
jan 1, 1998
1.197 bln
+50.062 mln
4.37%
jan 1, 1999
1.114 bln
-82.69 mln
-6.91%
jan 1, 2000
1.267 bln
+152.87 mln
13.72%
jan 1, 2001
1.16 bln
-106.929 mln
-8.44%
jan 1, 2002
1.001 bln
-159.011 mln
-13.71%
jan 1, 2003
1.185 bln
+183.605 mln
18.34%
jan 1, 2004
1.503 bln
+317.879 mln
26.83%
jan 1, 2005
1.744 bln
+241.296 mln
16.06%
jan 1, 2006
1.972 bln
+228.321 mln
13.09%
jan 1, 2007
2.152 bln
+179.4 mln
9.1%
jan 1, 2008
2.809 bln
+657.596 mln
30.56%
jan 1, 2009
3.013 bln
+203.575 mln
7.25%
jan 1, 2010
2.832 bln
-180.542 mln
-5.99%
jan 1, 2011
3.424 bln
+591.241 mln
20.87%
jan 1, 2012
4.111 bln
+687.016 mln
20.07%
jan 1, 2013
4.186 bln
+74.984 mln
1.82%
jan 1, 2014
3.984 bln
-201.349 mln
-4.81%
jan 1, 2015
3.996 bln
+11.348 mln
0.28%
jan 1, 2016
3.525 bln
-470.198 mln
-11.77%
Ranking of countries by current statistics by years


Comments: