29
/
en
AIzaSyAYiBZKx7MnpbEhh9jyipgxe19OcubqV5w
April 1, 2024
225663
Portugal
PRT
true
2
1
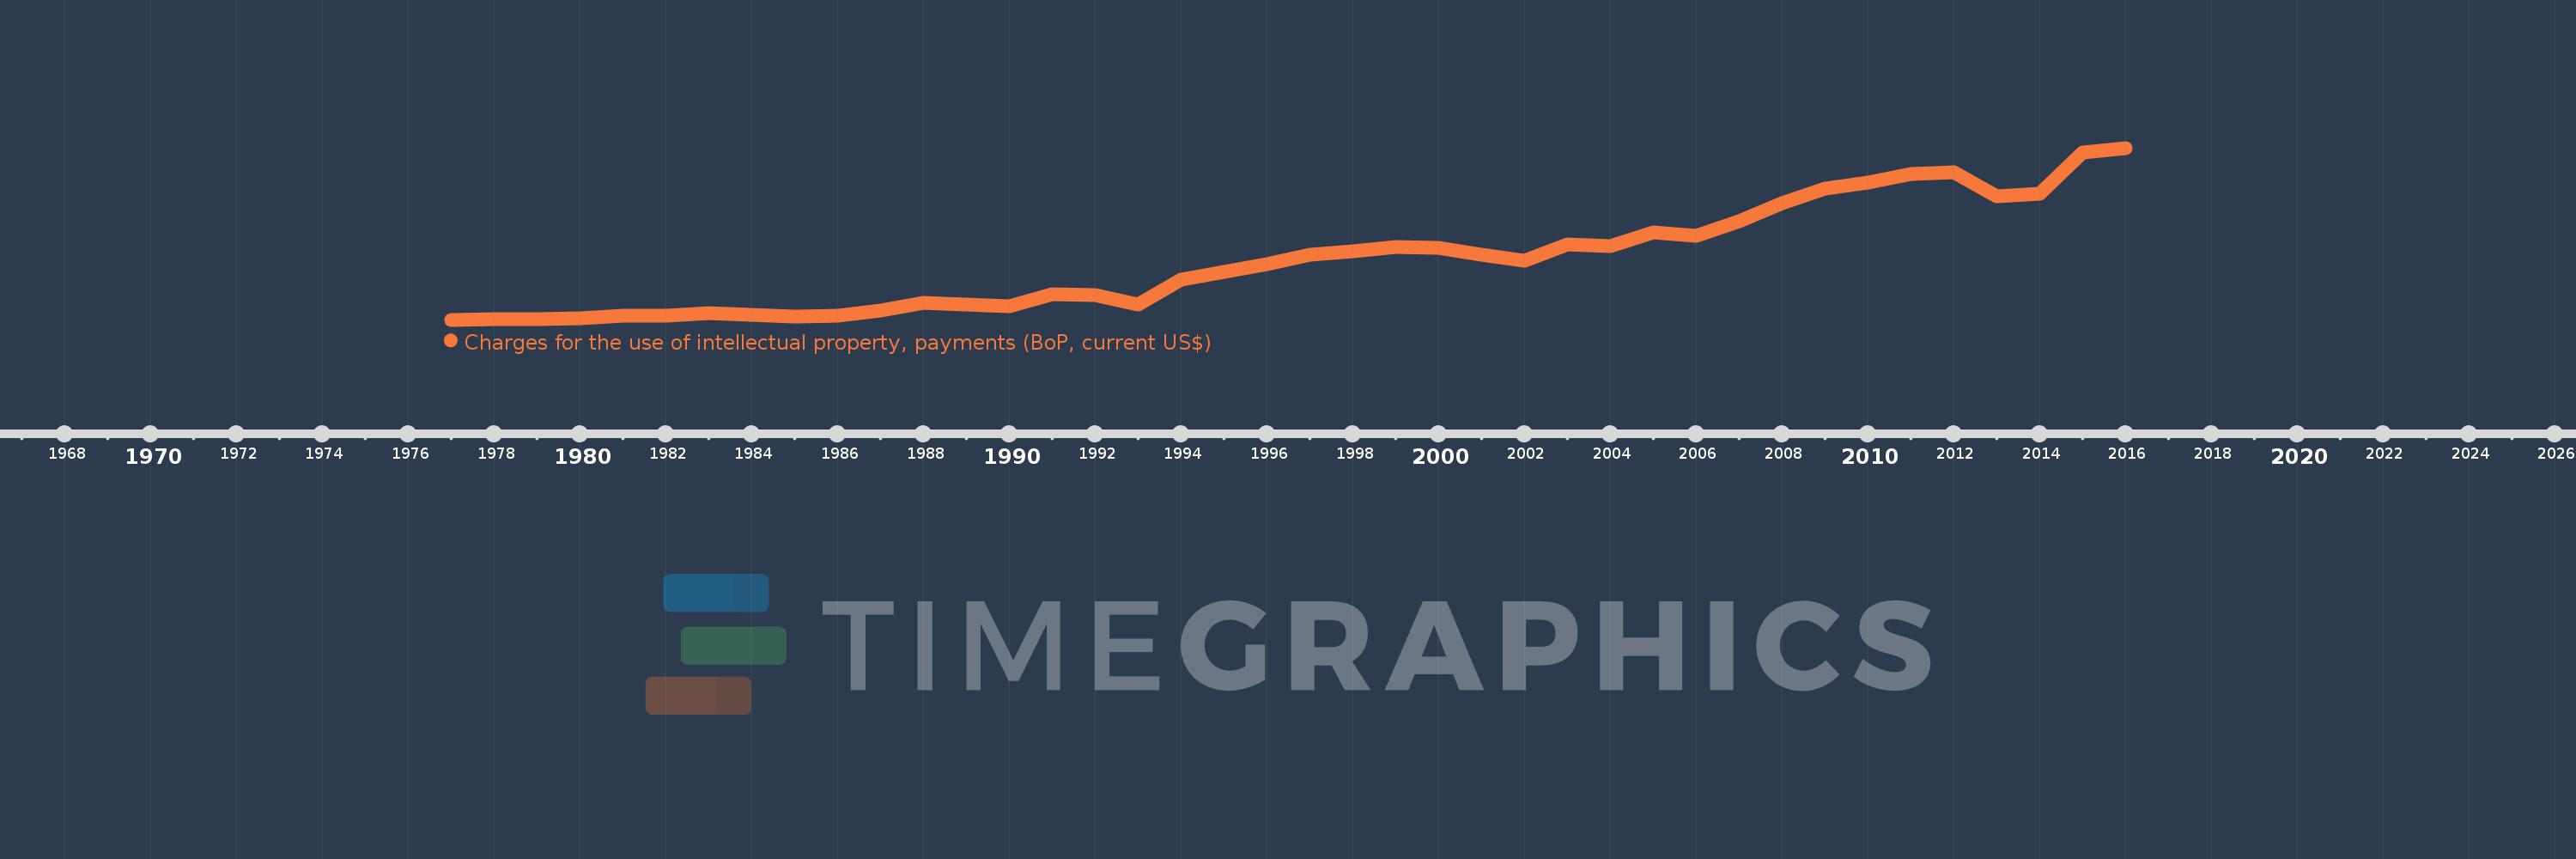
Charges for the use of intellectual property, payments (BoP, current US$)
2016,2015,2014,2013,2012,2011,2010,2009,2008,2007,2006,2005,2004,2003,2002,2001,2000,1999,1998,1997,1996,1995,1994,1993,1992,1991,1990,1989,1988,1987,1986,1985,1984,1983,1982,1981,1980,1979,1978,1977
This statistics in other country:
Timeline:
This timeline shows a graph from 1977 to 2016 of Portugal. No data until 1976. Number of actual observations by date: 40.
Source name:
World Development Indicators
Source organization:
International Monetary Fund, Balance of Payments Statistics Yearbook and data files.
Categories, topics:
Economy & Growth, Science & Technology
Last updated:
apr 23, 2017
Indicators value changes by year
Minimum:
16.342 mln
jan 1, 1977
Maximum:
697.578 mln
jan 1, 2016
At the date of observation
Value
Absolute change
Change from previous value
jan 1, 1977
16.342 mln
+16.342 mln
0.0%
jan 1, 1978
19.927 mln
+3.585 mln
21.94%
jan 1, 1979
18.05 mln
-1.877 mln
-9.42%
jan 1, 1980
22.458 mln
+4.408 mln
24.42%
jan 1, 1981
31.269 mln
+8.811 mln
39.24%
jan 1, 1982
33.176 mln
+1.907 mln
6.1%
jan 1, 1983
41.62 mln
+8.443 mln
25.45%
jan 1, 1984
37.301 mln
-4.319 mln
-10.38%
jan 1, 1985
29.516 mln
-7.785 mln
-20.87%
jan 1, 1986
33.225 mln
+3.709 mln
12.57%
jan 1, 1987
51.573 mln
+18.347 mln
55.22%
jan 1, 1988
81.88 mln
+30.308 mln
58.77%
jan 1, 1989
76.627 mln
-5.253 mln
-6.42%
jan 1, 1990
68.657 mln
-7.97 mln
-10.4%
jan 1, 1991
116.575 mln
+47.918 mln
69.79%
jan 1, 1992
114.318 mln
-2.257 mln
-1.94%
jan 1, 1993
75.434 mln
-38.884 mln
-34.01%
jan 1, 1994
174.251 mln
+98.817 mln
131.0%
jan 1, 1995
206.291 mln
+32.04 mln
18.39%
jan 1, 1996
236.796 mln
+30.505 mln
14.79%
jan 1, 1997
274.306 mln
+37.51 mln
15.84%
jan 1, 1998
287.874 mln
+13.568 mln
4.95%
jan 1, 1999
303.731 mln
+15.857 mln
5.51%
jan 1, 2000
301.08 mln
-2.652 mln
-0.87%
jan 1, 2001
275.327 mln
-25.753 mln
-8.55%
jan 1, 2002
250.734 mln
-24.593 mln
-8.93%
jan 1, 2003
313.866 mln
+63.132 mln
25.18%
jan 1, 2004
307.401 mln
-6.465 mln
-2.06%
jan 1, 2005
361.515 mln
+54.114 mln
17.6%
jan 1, 2006
349.805 mln
-11.711 mln
-3.24%
jan 1, 2007
408.391 mln
+58.586 mln
16.75%
jan 1, 2008
479.585 mln
+71.194 mln
17.43%
jan 1, 2009
534.885 mln
+55.3 mln
11.53%
jan 1, 2010
561.847 mln
+26.962 mln
5.04%
jan 1, 2011
596.016 mln
+34.17 mln
6.08%
jan 1, 2012
600.209 mln
+4.192 mln
0.7%
jan 1, 2013
505.371 mln
-94.837 mln
-15.8%
jan 1, 2014
517.72 mln
+12.348 mln
2.44%
jan 1, 2015
680.328 mln
+162.608 mln
31.41%
jan 1, 2016
697.578 mln
+17.25 mln
2.54%
Ranking of countries by current statistics by years


Comments: