29
/
en
AIzaSyAYiBZKx7MnpbEhh9jyipgxe19OcubqV5w
April 1, 2024
36398
IBRD only
IBD
false
2
1
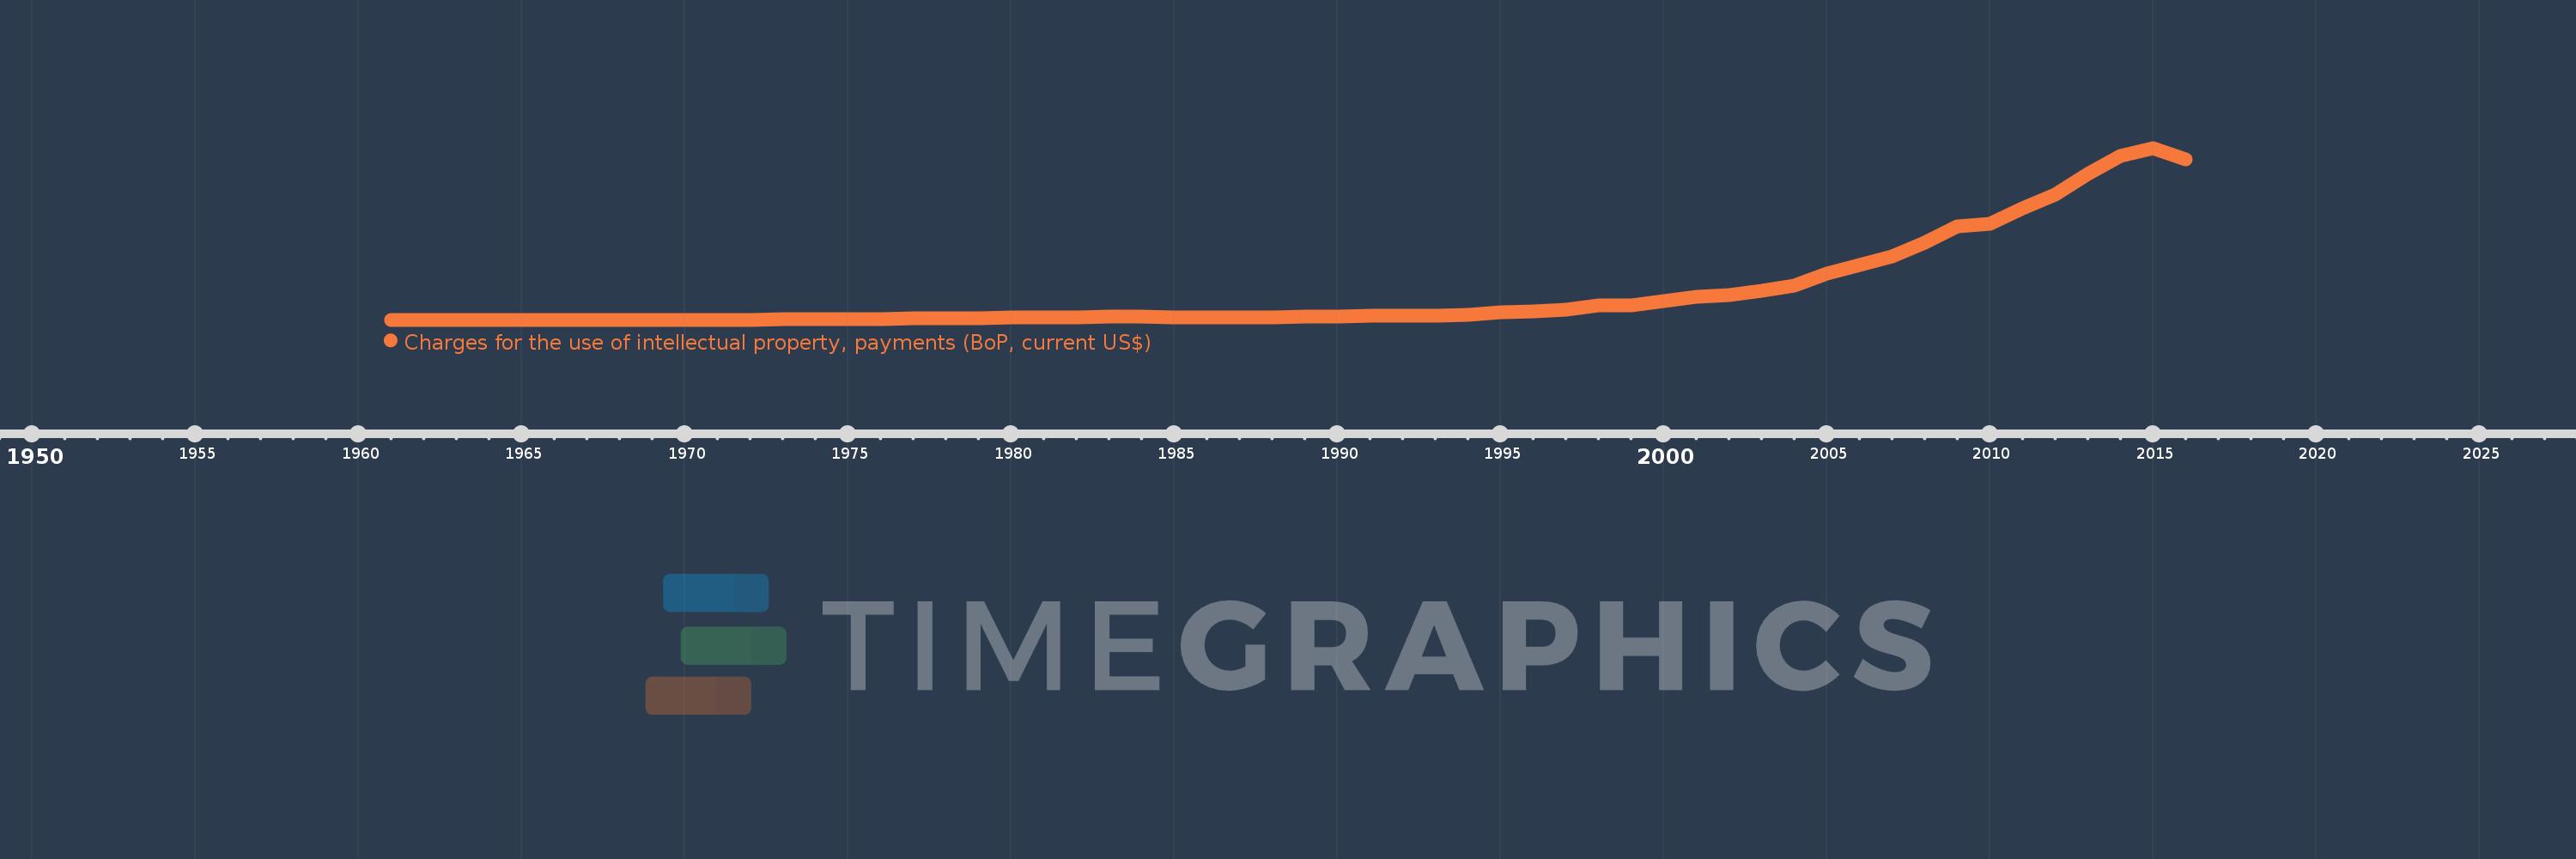
Charges for the use of intellectual property, payments (BoP, current US$)
2016,2015,2014,2013,2012,2011,2010,2009,2008,2007,2006,2005,2004,2003,2002,2001,2000,1999,1998,1997,1996,1995,1994,1993,1992,1991,1990,1989,1988,1987,1986,1985,1984,1983,1982,1981,1980,1979,1978,1977,1976,1975,1974,1973,1972,1971,1970,1969,1968,1967,1966,1965,1964,1963,1962,1961
This statistics in other country:
Timeline:
This timeline shows a graph from 1961 to 2016 of IBRD only. No data until 1960. Number of actual observations by date: 56.
Source name:
World Development Indicators
Source organization:
International Monetary Fund, Balance of Payments Statistics Yearbook and data files.
Categories, topics:
Economy & Growth, Science & Technology
Last updated:
apr 23, 2017
Indicators value changes by year
Minimum:
5.6 mln
jan 1, 1961
Maximum:
64.574 bln
jan 1, 2015
At the date of observation
Value
Absolute change
Change from previous value
jan 1, 1961
5.6 mln
+5.6 mln
0.0%
jan 1, 1962
5.6 mln
0.0
0.0%
jan 1, 1963
8.4 mln
+2.8 mln
50.0%
jan 1, 1964
15.4 mln
+7.0 mln
83.33%
jan 1, 1965
15.4 mln
0.0
0.0%
jan 1, 1966
26.6 mln
+11.2 mln
72.73%
jan 1, 1967
26.6 mln
0.0
0.0%
jan 1, 1968
32.2 mln
+5.6 mln
21.05%
jan 1, 1969
45.8 mln
+13.6 mln
42.24%
jan 1, 1970
46.2 mln
+399.999K
0.87%
jan 1, 1971
56.2 mln
+10.0 mln
21.65%
jan 1, 1972
48.53 mln
-7.67 mln
-13.65%
jan 1, 1973
70.29 mln
+21.76 mln
44.84%
jan 1, 1974
86.424 mln
+16.134 mln
22.95%
jan 1, 1975
80.567 mln
-5.857 mln
-6.78%
jan 1, 1976
377.82 mln
+297.253 mln
368.95%
jan 1, 1977
499.429 mln
+121.609 mln
32.19%
jan 1, 1978
501.288 mln
+1.859 mln
0.37%
jan 1, 1979
586.036 mln
+84.748 mln
16.91%
jan 1, 1980
763.355 mln
+177.32 mln
30.26%
jan 1, 1981
744.347 mln
-19.009 mln
-2.49%
jan 1, 1982
1.023 bln
+278.644 mln
37.43%
jan 1, 1983
1.04 bln
+16.803 mln
1.64%
jan 1, 1984
1.073 bln
+33.204 mln
3.19%
jan 1, 1985
968.933 mln
-104.065 mln
-9.7%
jan 1, 1986
926.298 mln
-42.636 mln
-4.4%
jan 1, 1987
988.638 mln
+62.34 mln
6.73%
jan 1, 1988
1.027 bln
+37.869 mln
3.83%
jan 1, 1989
1.12 bln
+93.564 mln
9.11%
jan 1, 1990
1.317 bln
+196.728 mln
17.56%
jan 1, 1991
1.463 bln
+146.617 mln
11.13%
jan 1, 1992
1.566 bln
+102.307 mln
6.99%
jan 1, 1993
1.594 bln
+28.22 mln
1.8%
jan 1, 1994
1.901 bln
+307.5 mln
19.29%
jan 1, 1995
2.94 bln
+1.038 bln
54.61%
jan 1, 1996
3.122 bln
+181.746 mln
6.18%
jan 1, 1997
3.852 bln
+730.708 mln
23.41%
jan 1, 1998
5.472 bln
+1.619 bln
42.03%
jan 1, 1999
5.317 bln
-154.739 mln
-2.83%
jan 1, 2000
7.158 bln
+1.841 bln
34.63%
jan 1, 2001
8.64 bln
+1.482 bln
20.71%
jan 1, 2002
9.229 bln
+589.121 mln
6.82%
jan 1, 2003
11.011 bln
+1.781 bln
19.3%
jan 1, 2004
12.953 bln
+1.943 bln
17.64%
jan 1, 2005
17.434 bln
+4.481 bln
34.59%
jan 1, 2006
20.729 bln
+3.295 bln
18.9%
jan 1, 2007
23.689 bln
+2.96 bln
14.28%
jan 1, 2008
28.978 bln
+5.289 bln
22.32%
jan 1, 2009
35.238 bln
+6.26 bln
21.6%
jan 1, 2010
35.958 bln
+719.657 mln
2.04%
jan 1, 2011
41.813 bln
+5.855 bln
16.28%
jan 1, 2012
46.991 bln
+5.178 bln
12.38%
jan 1, 2013
54.637 bln
+7.645 bln
16.27%
jan 1, 2014
61.482 bln
+6.845 bln
12.53%
jan 1, 2015
64.574 bln
+3.092 bln
5.03%
jan 1, 2016
60.161 bln
-4.413 bln
-6.83%
Ranking of countries by current statistics by years


Comments: