29
/
en
AIzaSyAYiBZKx7MnpbEhh9jyipgxe19OcubqV5w
April 1, 2024
40532
Late-demographic dividend
LTE
false
2
1
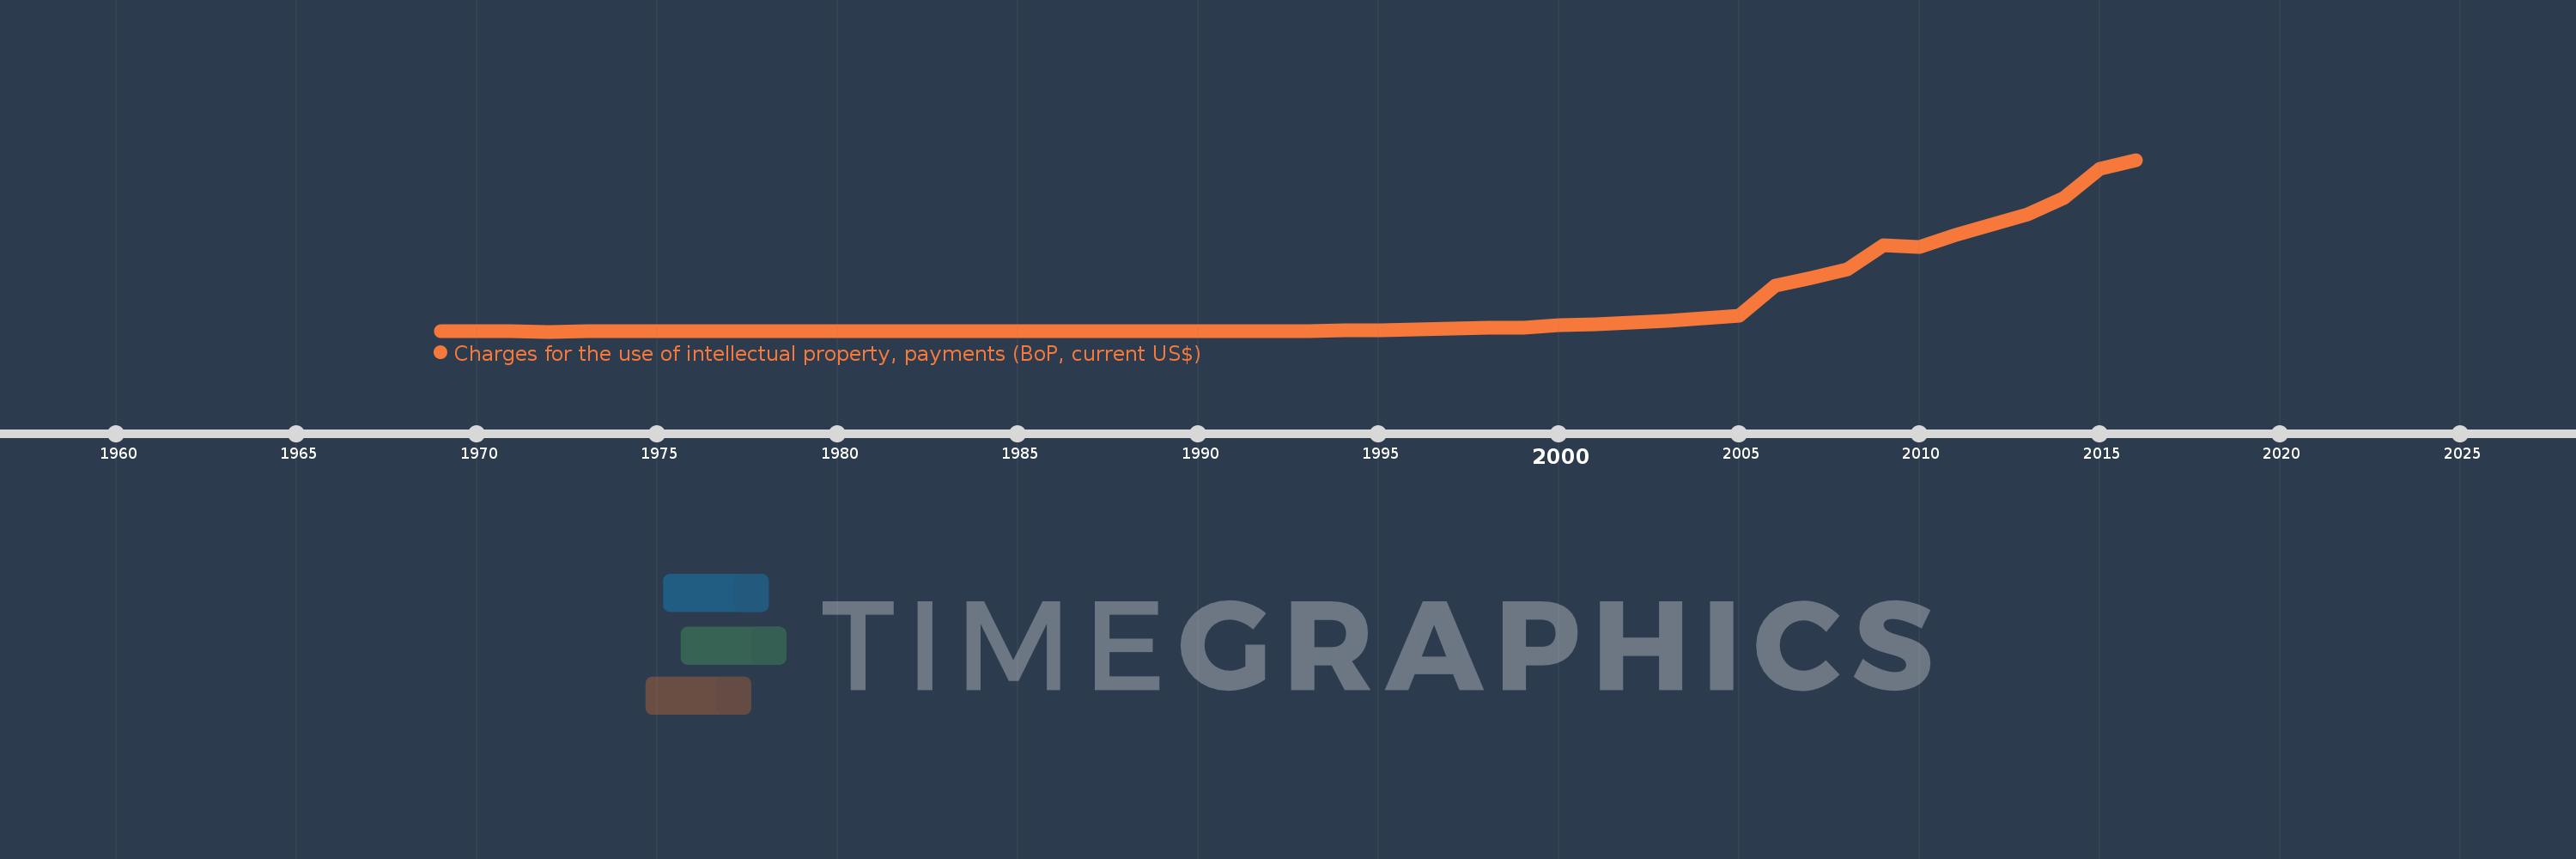
Charges for the use of intellectual property, payments (BoP, current US$)
2016,2015,2014,2013,2012,2011,2010,2009,2008,2007,2006,2005,2004,2003,2002,2001,2000,1999,1998,1997,1996,1995,1994,1993,1992,1991,1990,1989,1988,1987,1986,1985,1984,1983,1982,1981,1980,1979,1978,1977,1976,1975,1974,1973,1972,1971,1970,1969
This statistics in other country:
Timeline:
This timeline shows a graph from 1969 to 2016 of Late-demographic dividend. No data until 1968. Number of actual observations by date: 48.
Source name:
World Development Indicators
Source organization:
International Monetary Fund, Balance of Payments Statistics Yearbook and data files.
Categories, topics:
Economy & Growth, Science & Technology
Last updated:
apr 23, 2017
Indicators value changes by year
Minimum:
1.003 mln
jan 1, 1972
Maximum:
120.629 bln
jan 1, 2016
At the date of observation
Value
Absolute change
Change from previous value
jan 1, 1969
8.0 mln
+8.0 mln
0.0%
jan 1, 1970
7.0 mln
-1000.0K
-12.5%
jan 1, 1971
10.0 mln
+3.0 mln
42.86%
jan 1, 1972
1.003 mln
-8.997 mln
-89.97%
jan 1, 1973
6.514 mln
+5.511 mln
549.49%
jan 1, 1974
8.345 mln
+1.831 mln
28.1%
jan 1, 1975
8.418 mln
+73.57K
0.88%
jan 1, 1976
270.777 mln
+262.358 mln
3.12K%
jan 1, 1977
328.953 mln
+58.177 mln
21.49%
jan 1, 1978
255.747 mln
-73.206 mln
-22.25%
jan 1, 1979
296.306 mln
+40.559 mln
15.86%
jan 1, 1980
150.986 mln
-145.32 mln
-49.04%
jan 1, 1981
197.214 mln
+46.228 mln
30.62%
jan 1, 1982
201.105 mln
+3.891 mln
1.97%
jan 1, 1983
149.088 mln
-52.017 mln
-25.87%
jan 1, 1984
145.115 mln
-3.973 mln
-2.66%
jan 1, 1985
140.987 mln
-4.128 mln
-2.84%
jan 1, 1986
147.149 mln
+6.162 mln
4.37%
jan 1, 1987
160.959 mln
+13.81 mln
9.39%
jan 1, 1988
200.385 mln
+39.426 mln
24.49%
jan 1, 1989
261.368 mln
+60.984 mln
30.43%
jan 1, 1990
334.44 mln
+73.072 mln
27.96%
jan 1, 1991
365.942 mln
+31.501 mln
9.42%
jan 1, 1992
408.237 mln
+42.296 mln
11.56%
jan 1, 1993
493.959 mln
+85.722 mln
21.0%
jan 1, 1994
716.945 mln
+222.986 mln
45.14%
jan 1, 1995
1.012 bln
+295.391 mln
41.2%
jan 1, 1996
1.561 bln
+549.016 mln
54.23%
jan 1, 1997
2.212 bln
+650.61 mln
41.67%
jan 1, 1998
2.96 bln
+747.976 mln
33.82%
jan 1, 1999
2.875 bln
-84.918 mln
-2.87%
jan 1, 2000
4.482 bln
+1.607 bln
55.88%
jan 1, 2001
5.263 bln
+781.506 mln
17.44%
jan 1, 2002
6.302 bln
+1.039 bln
19.75%
jan 1, 2003
7.719 bln
+1.417 bln
22.49%
jan 1, 2004
9.053 bln
+1.334 bln
17.28%
jan 1, 2005
10.901 bln
+1.848 bln
20.41%
jan 1, 2006
32.518 bln
+21.616 bln
198.29%
jan 1, 2007
37.747 bln
+5.229 bln
16.08%
jan 1, 2008
43.721 bln
+5.975 bln
15.83%
jan 1, 2009
60.607 bln
+16.885 bln
38.62%
jan 1, 2010
59.654 bln
-952.728 mln
-1.57%
jan 1, 2011
67.699 bln
+8.045 bln
13.49%
jan 1, 2012
75.093 bln
+7.394 bln
10.92%
jan 1, 2013
82.504 bln
+7.411 bln
9.87%
jan 1, 2014
93.792 bln
+11.287 bln
13.68%
jan 1, 2015
114.273 bln
+20.481 bln
21.84%
jan 1, 2016
120.629 bln
+6.356 bln
5.56%
Ranking of countries by current statistics by years


Comments: