29
/
en
AIzaSyAYiBZKx7MnpbEhh9jyipgxe19OcubqV5w
April 1, 2024
139053
Germany
DEU
true
2
1
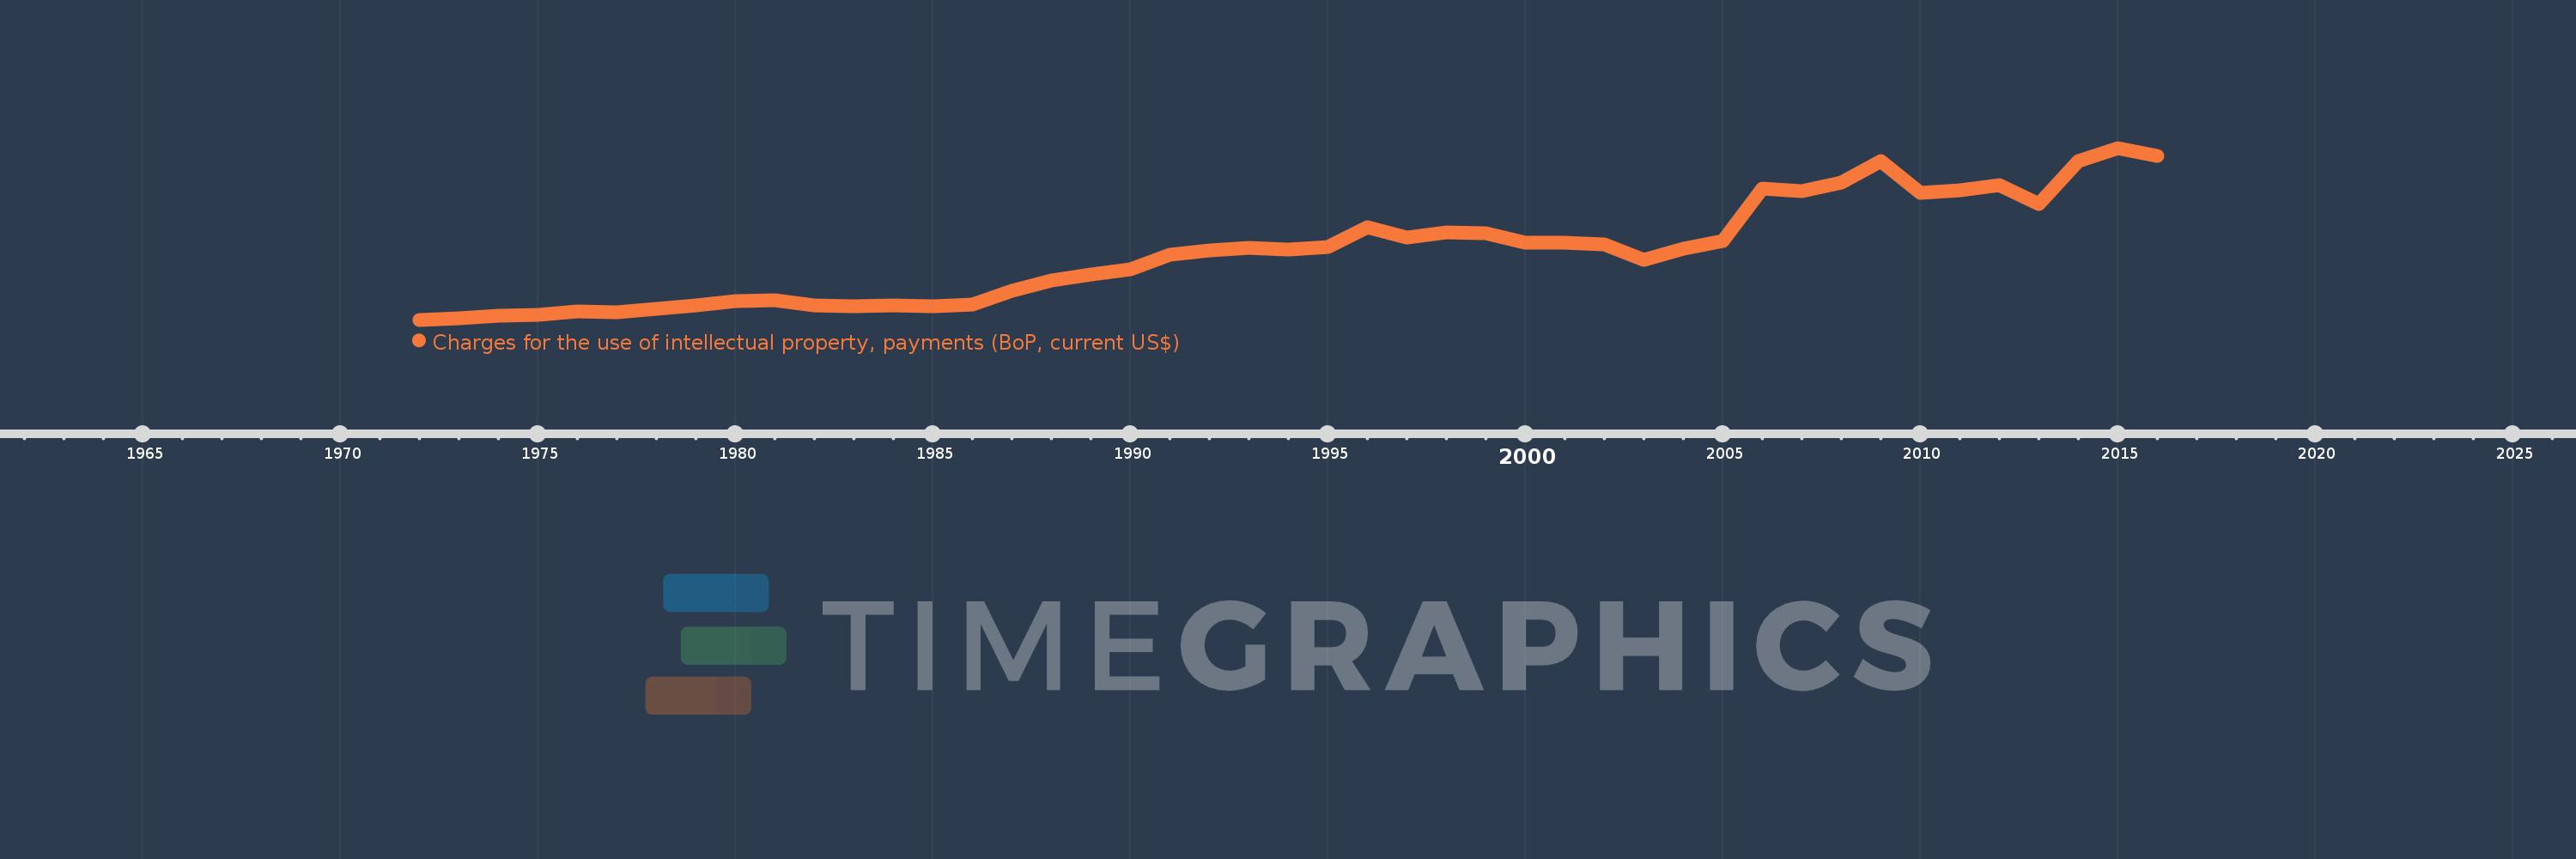
Charges for the use of intellectual property, payments (BoP, current US$)
2016,2015,2014,2013,2012,2011,2010,2009,2008,2007,2006,2005,2004,2003,2002,2001,2000,1999,1998,1997,1996,1995,1994,1993,1992,1991,1990,1989,1988,1987,1986,1985,1984,1983,1982,1981,1980,1979,1978,1977,1976,1975,1974,1973,1972
This statistics in other country:
Timeline:
This timeline shows a graph from 1972 to 2016 of Germany. No data until 1971. Number of actual observations by date: 45.
Source name:
World Development Indicators
Source organization:
International Monetary Fund, Balance of Payments Statistics Yearbook and data files.
Categories, topics:
Economy & Growth, Science & Technology
Last updated:
apr 23, 2017
Indicators value changes by year
Minimum:
423.474 mln
jan 1, 1972
Maximum:
9.311 bln
jan 1, 2015
At the date of observation
Value
Absolute change
Change from previous value
jan 1, 1972
423.474 mln
+423.474 mln
0.0%
jan 1, 1973
493.347 mln
+69.873 mln
16.5%
jan 1, 1974
624.131 mln
+130.783 mln
26.51%
jan 1, 1975
669.98 mln
+45.849 mln
7.35%
jan 1, 1976
836.978 mln
+166.999 mln
24.93%
jan 1, 1977
805.22 mln
-31.758 mln
-3.79%
jan 1, 1978
986.662 mln
+181.441 mln
22.53%
jan 1, 1979
1.187 bln
+200.745 mln
20.35%
jan 1, 1980
1.372 bln
+184.384 mln
15.53%
jan 1, 1981
1.446 bln
+74.068 mln
5.4%
jan 1, 1982
1.186 bln
-259.874 mln
-17.97%
jan 1, 1983
1.117 bln
-69.338 mln
-5.85%
jan 1, 1984
1.184 bln
+67.166 mln
6.01%
jan 1, 1985
1.116 bln
-67.336 mln
-5.69%
jan 1, 1986
1.214 bln
+97.508 mln
8.73%
jan 1, 1987
1.927 bln
+713.443 mln
58.77%
jan 1, 1988
2.456 bln
+528.874 mln
27.44%
jan 1, 1989
2.744 bln
+287.377 mln
11.7%
jan 1, 1990
3.027 bln
+283.742 mln
10.34%
jan 1, 1991
3.797 bln
+769.962 mln
25.43%
jan 1, 1992
3.996 bln
+199.012 mln
5.24%
jan 1, 1993
4.154 bln
+158.051 mln
3.95%
jan 1, 1994
4.043 bln
-111.285 mln
-2.68%
jan 1, 1995
4.171 bln
+127.883 mln
3.16%
jan 1, 1996
5.23 bln
+1.058 bln
25.38%
jan 1, 1997
4.688 bln
-541.282 mln
-10.35%
jan 1, 1998
4.962 bln
+273.519 mln
5.83%
jan 1, 1999
4.905 bln
-57.229 mln
-1.15%
jan 1, 2000
4.395 bln
-509.026 mln
-10.38%
jan 1, 2001
4.414 bln
+18.283 mln
0.42%
jan 1, 2002
4.316 bln
-98.014 mln
-2.22%
jan 1, 2003
3.542 bln
-773.992 mln
-17.93%
jan 1, 2004
4.113 bln
+570.959 mln
16.12%
jan 1, 2005
4.511 bln
+398.364 mln
9.69%
jan 1, 2006
7.212 bln
+2.701 bln
59.87%
jan 1, 2007
7.082 bln
-130.191 mln
-1.81%
jan 1, 2008
7.501 bln
+419.286 mln
5.92%
jan 1, 2009
8.632 bln
+1.132 bln
15.09%
jan 1, 2010
7.002 bln
-1.63 bln
-18.88%
jan 1, 2011
7.117 bln
+114.593 mln
1.64%
jan 1, 2012
7.4 bln
+283.311 mln
3.98%
jan 1, 2013
6.399 bln
-1.001 bln
-13.53%
jan 1, 2014
8.643 bln
+2.244 bln
35.06%
jan 1, 2015
9.311 bln
+668.497 mln
7.73%
jan 1, 2016
8.917 bln
-394.393 mln
-4.24%
Ranking of countries by current statistics by years


Comments: