29
/
en
AIzaSyAYiBZKx7MnpbEhh9jyipgxe19OcubqV5w
April 1, 2024
247332
Spain
ESP
true
2
1
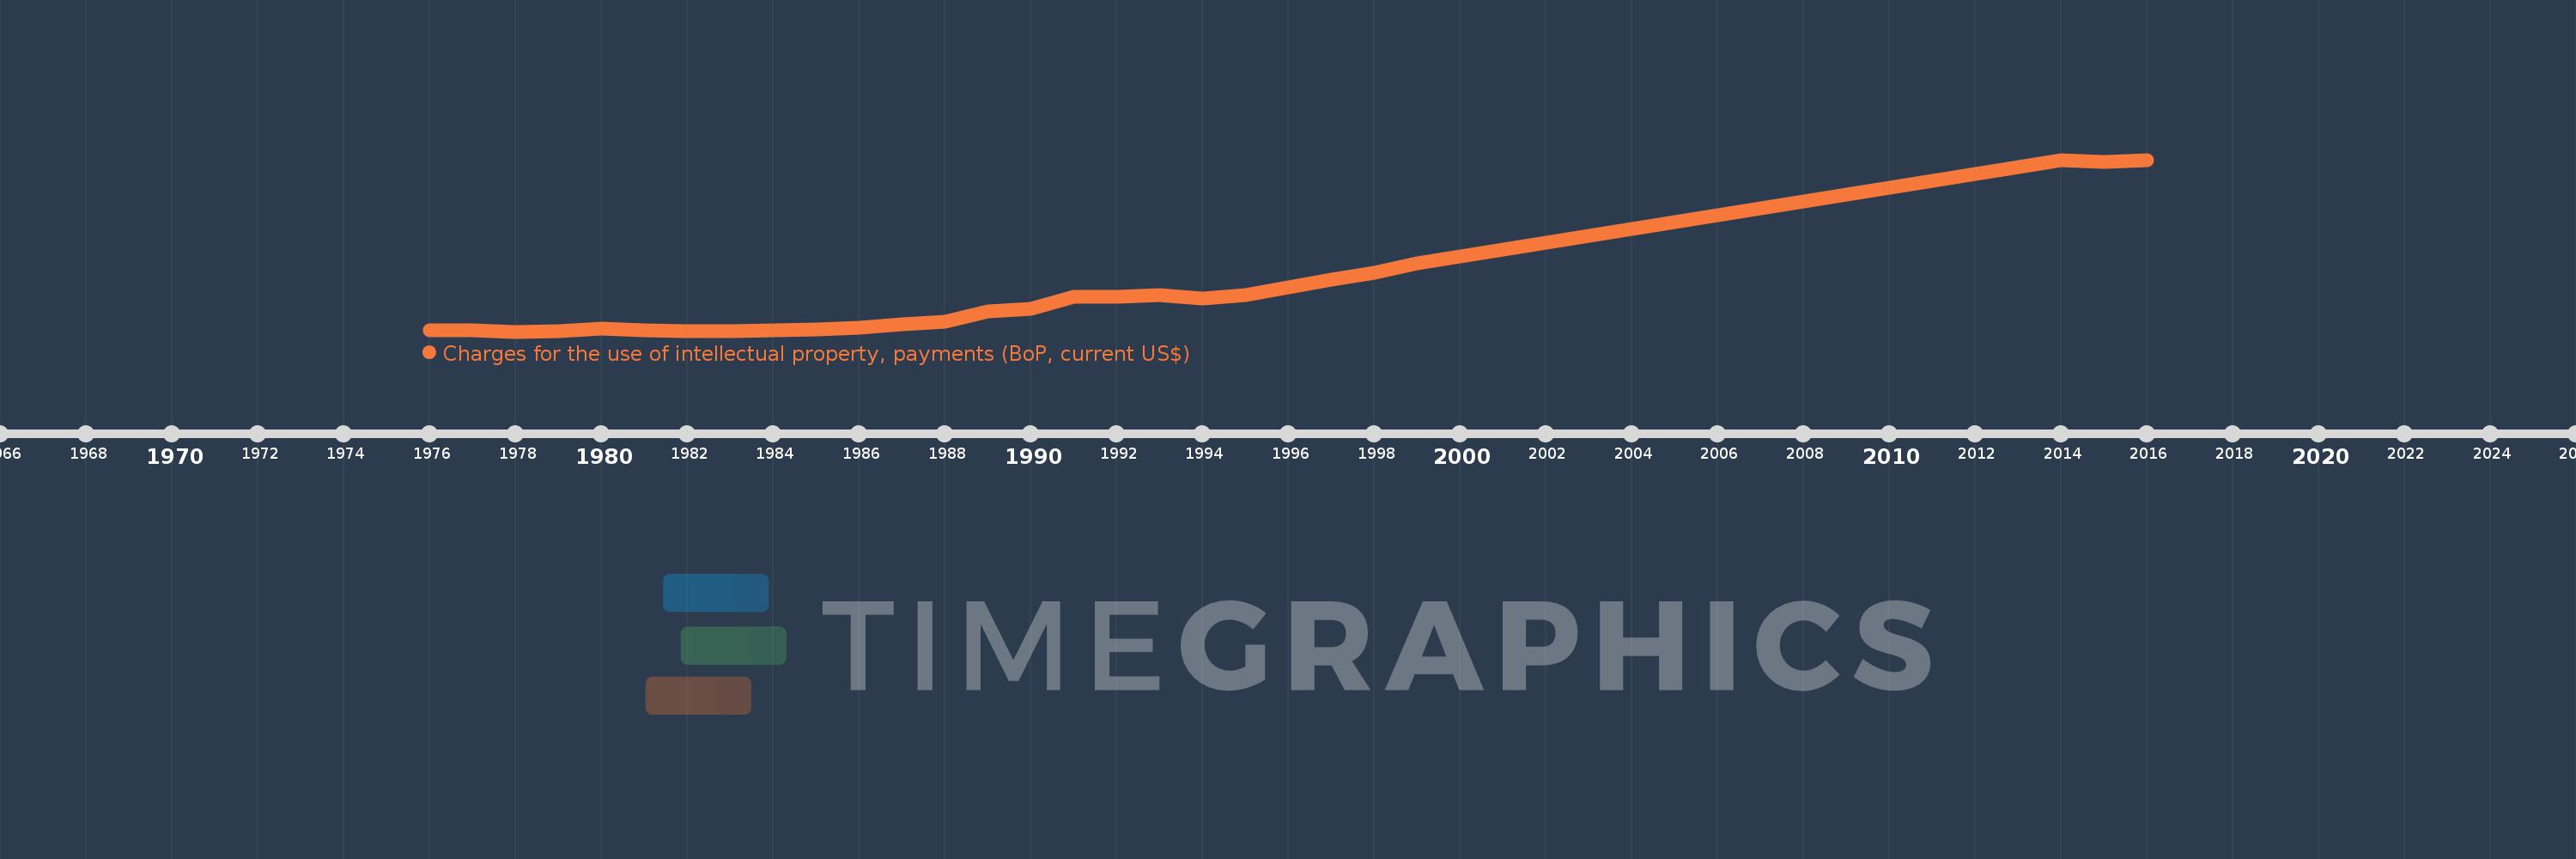
Charges for the use of intellectual property, payments (BoP, current US$)
2016,2015,2014,1999,1998,1997,1996,1995,1994,1993,1992,1991,1990,1989,1988,1987,1986,1985,1984,1983,1982,1981,1980,1979,1978,1977,1976
This statistics in other country:
Timeline:
This timeline shows a graph from 1976 to 2016 of Spain. No data until 1975. Number of actual observations by date: 27.
Source name:
World Development Indicators
Source organization:
International Monetary Fund, Balance of Payments Statistics Yearbook and data files.
Categories, topics:
Economy & Growth, Science & Technology
Last updated:
apr 23, 2017
Indicators value changes by year
Minimum:
129.208 mln
jan 1, 1978
Maximum:
4.519 bln
jan 1, 2016
At the date of observation
Value
Absolute change
Change from previous value
jan 1, 1976
167.699 mln
+167.699 mln
0.0%
jan 1, 1977
159.014 mln
-8.686 mln
-5.18%
jan 1, 1978
129.208 mln
-29.806 mln
-18.74%
jan 1, 1979
134.316 mln
+5.108 mln
3.95%
jan 1, 1980
198.207 mln
+63.892 mln
47.57%
jan 1, 1981
169.967 mln
-28.24 mln
-14.25%
jan 1, 1982
135.229 mln
-34.739 mln
-20.44%
jan 1, 1983
149.581 mln
+14.352 mln
10.61%
jan 1, 1984
164.889 mln
+15.309 mln
10.23%
jan 1, 1985
184.667 mln
+19.778 mln
11.99%
jan 1, 1986
229.216 mln
+44.549 mln
24.12%
jan 1, 1987
306.565 mln
+77.349 mln
33.74%
jan 1, 1988
379.394 mln
+72.829 mln
23.76%
jan 1, 1989
647.125 mln
+267.731 mln
70.57%
jan 1, 1990
702.37 mln
+55.245 mln
8.54%
jan 1, 1991
1.022 bln
+319.3 mln
45.46%
jan 1, 1992
1.021 bln
-982.043K
-0.1%
jan 1, 1993
1.07 bln
+49.314 mln
4.83%
jan 1, 1994
982.797 mln
-87.205 mln
-8.15%
jan 1, 1995
1.061 bln
+78.548 mln
7.99%
jan 1, 1996
1.266 bln
+204.88 mln
19.3%
jan 1, 1997
1.447 bln
+181.145 mln
14.31%
jan 1, 1998
1.644 bln
+196.14 mln
13.55%
jan 1, 1999
1.878 bln
+234.808 mln
14.29%
jan 1, 2014
4.514 bln
+2.636 bln
140.34%
jan 1, 2015
4.473 bln
-40.963 mln
-0.91%
jan 1, 2016
4.519 bln
+45.422 mln
1.02%
Ranking of countries by current statistics by years


Comments: